
Supervised by: Yash Salunkhe BSc (Hons). Yash is currently completing his MPhil in Economic Research at the University of Cambridge. He gained his BSc Econometrics and Mathematical Economics (EME) at the London School of Economics (LSE) in 2018. From 2018-19, Yash worked in Venture Capital in Pune, India, evaluating startups with a positive social impact. From 2019-2021, he worked in Wealth Management, helping large institutions invest their portfolios above $25 million. He has co-founded 2 charities: one focuses on improving outcomes in under-funded schools in India and the other was involved in varied community development projects.
Abstract
This research paper examines the intricate dynamics of oil price fluctuations in recent history, focusing on the interplay of three crucial factors: dollar deflation with regard to BRICS policies, and the Russia-Ukraine conflict. The study delves into the impact of each element on the global oil market, drawing insights from an extensive analysis of economic data and geopolitical developments.
The paper begins by analysing the impact of oil trade between several G20 countries, including both importers or exporters. It explores the historical relationship between the US dollar and oil prices, highlighting the implications of currency fluctuations on oil-producing and oil-consuming nations. The research focuses on the influence of monetary policies and global economic events on oil prices and their implications on the economic growth of the involved nations.
Next, the paper explores the collective policies of the BRICS nations (Brazil, Russia, India, China, and South Africa) and their impact on oil prices and dollar deflation. It assesses how these emerging economies have formed strategic alliances to diversify energy markets and currency use, reducing their dependence on traditional Western suppliers. The study also examines the BRICS countries’ initiatives to establish bilateral energy agreements, leading to changes in supply and demand dynamics in the global oil market.
Lastly, the research investigates the recent Russia-Ukraine conflict and its implications on oil and natural gas prices. It analyses how geopolitical tensions and sanctions have affected oil supply, transit, and pricing dynamics in the region and beyond. The study delves into the responses of other oil-producing and oil-consuming nations to the conflict, exploring the measures taken to safeguard their energy security and stability.
The paper aims to shed light on the multifaceted nature of oil price fluctuations in recent times, emphasising the intertwined effects of dollar deflation, BRICS policies, and geopolitical conflicts. The analysis provides valuable insights into recent policies, energy market participants, and investors in order to better understand and anticipate oil price movements in the ever-evolving global landscape.
Introduction
In modern trade markets, oil has become a commodity traded for both physical use and as a store of value in the stock markets, holding one of the largest financial investment pools. Its value not only lies in its use but also in the simple act of its trade and the intricate chains of import and export, as well as international and political climates that determine its price.
At its core, oil is a reliable financial and wealth-multiplying investment due to its high global dependency. Operating economies that are dependent on the purchase or export of oil facilitate its constant trade, guaranteeing returns to its investors. This research paper follows oil along its trade routes from the Caspian Basin to the Black Sea ports into the Americas and down into Africa. Influencing industries and civil structures – labour and trading structures in particular – under the new corporate structure of financialisation which diverts some revenue into financial investments that would have otherwise been pooled into investments in the actual production process. The tensions that arise are then in two separate spheres: international (arguably arising from geopolitical conflict and/or future trade impediments) and biopolitical (valuation of living labour, through politics and law, determining the value of a workforce, and the consequence it has on a labour force). The modern oil industry dates back to 1837 carrying varying levels of value to different financial systems. Its value today is assessed by exploring its implications and fluctuations in trading nations, including BRICS nations, the US, and the contrasting effects it had on various economic structures. The BRICS countries have begun changing policies and creating new treaties, with more and more countries applying to join every year. BRICS economies are also very diverse in trade, with oil being a major product. The necessity of oil is increasing every day, which gives the BRICS countries a stronghold position. With this position comes impacts to developing and developed nations, which is further discussed in this paper.
Moreover, the impact of the Russia-Ukraine conflict has been felt by several key importers and exporters in global markets, with the BRICS alliance having reinforced the significance of their fossil fuel supplies. Their capacity to export large quantities of energy supplies has proven to be advantageous, as G20 importers are forced to look for alternatives after the Ukraine war and the ensuing sanctions. On the other hand, Russia, an essential exporter among the BRICS nations, has shifted its focus and supplies towards Asian markets and other allied nations in response to the EU blockade (IEA, 2023).
1.0 G20 International Oil trade: Determinants of routes and its impact on international relations
1.1 Oil trade in the G20 nations
The G20 countries hold different positions in the oil manufacturing chain. Due to this, as well as their varying production levels, the G20 economies hold varying aims. The aims and the decisions they influence are explored through the analysis of their consequences.
1.1.1 US trade policy and trade positions
The US holds a unique global position as one of the largest exporters and importers of oil. The significance of the US lies in the way in which its oil trade routes are structured and the geopolitical conditions they create. Figure 1.1.1 illustrates the proportion of US imports, indicating geographical distribution as well as quantity.

Figure 1.1.1: Proportion of US crude oil imports by trade partner (2021).
As of 2022, 62% of oil that is imported into the US is from two countries – Canada and Mexico – that are protected by the North American Free Trade Agreement (NAFTA) (US Energy Information Administration, 2022). This largely localised influx of oil provides a degree of stability to the US; a layer of guarantee that protects the oil-dependent US economy. NAFTA conveniently covers the entirety of the North American continent, eliminating to a large degree a contingency that the US suffers with its other trade partners (a compromise in US geopolitical influence), asserting a high degree of influence on both these economies which are safe, concrete, and diplomatic states that generally align with the US on regional and global aims. Other nations included in this paper do not share the unique global influence or wealth of the US nor its comfortable geopolitical status.
The US oil trade routes are highly concentrated, and its export revenue of oil is highly vulnerable to any disruptions to trade from Canada. The US, however, runs a diversified economy on the whole, producing a large variety of goods that have secure, constant export revenue due to the creation of numerous channels of revenue.
1.1.2 Saudi Arabia Development
Saudi Arabia is the largest exporter of oil. In the last 15 years, Saudi Arabia has achieved one of the greatest economic developments, especially during the 1970-1980, with a 58% growth rate in 1970 (World Bank, 2022). Through the years, Saudi Arabia has risen to global power and influence in part due to its wealth and global market share of oil. The reasons for this sustained growth in GDP is twofold: firstly due to the dependable nature of oil and natural gas that have one of the most consistent demands, translating to continuous revenue.
Secondly, Saudi Arabia has experienced huge spikes of increased growth during most oil-related shortages anywhere else in the world, such as its 8.7% annual GDP growth rate in 2022 while the rest of the world faced recessions (IMF, 2022; Fattouh and Sen, 2015). The price elasticity of demand of Saudi oil is 0.13 – highly inelastic – translating to little change in quantity consumed in response to a change in price, meaning that Saudi oil revenue increases as oil prices rise.
Due to its high geopolitical influence in the area as well as its weak ties to any European or Western democratic treaties, Saudi Arabia is also less affected by sanctions placed by larger bodies such as the EU on its trading partners, including Russia.
Saudi Arabia has approximately 267.2 billion barrels of oil in its reserves (Woldometer, 2021). The Saudi Government is attempting to diversify its sources of export revenue mainly into tourism, whilst its export markets for oil are sufficiently diverse. Oil pipelines have routes that pass through Turkey, Persia, and then into Asia.
Fattouh and Sen (2015) explore now-passed Saudi oil trade policies, explaining the influence of Saudi Arabia on global oil markets; influence that is dependent on their management of idle capacity. An imbalance causing either loss of market control (acute decrease in idle capacity which increases supply) or loss of revenue (acute increase in idle capacity; not enough exports). In terms of their trade in oil, the countries studied by Fattouh and Sen share a problem: dependence, albeit from two opposite sides of the spectrum, with Turkey being dependent on imports of oil while Saudi Arabia is dependent on oil and gas exports (Fattouh and Sen, 2015). Saudi Arabia has adopted policies of diversification and horizontal integration which provides opportunities for diversification and downstream integration into the full value chain, including the development of new industries. Critics, however, point out the possibility that one of the intended aims of increasing employment might not be met. Oil dependent nations such as Turkey are facing the oil and gas security issue which has an “impact on the vulnerability of the entire economic system” (Ediger and Berk, 2011).
1.1.3 Turkey: a geopolitically influenced market
As the above major exporters push oil into the global markets, the treaties that protect these pipes and trucks are enforced by global powers. These powers trading security, trade and aid in a precarious game that slowly solidifies into peaceful passage. Each involved nation compromises to maximise personal interests.
Geographically, Turkey serves as an advantageous port connecting Asia to Europe. Its interest, particularly in Ceyhan, is protected by the US. The Black Sea ports belong to historically divided countries and political ideologies, with the US levying promises of security to protect political and economic interests in the area to undermine Russian influence.
Turkey also is one of the most oil import dependent nations in the world with no internationally dominant exports of its own; this leaves the economy highly susceptible to any trade disruptions, a significant threat considering its geographical position, making Turkey dependent on Western investment in the region.
1.1.4 Mexico
NAFTA essentially created a free trade zone. Canada, Mexico, and the US traded without any of their economies suffering the consequences of protectionism from their partners’ goods. Companies in each economy assess their varying returns and production capacities between the three countries and, depending on the sector, choose the optimum production environment. In the US, manufacturing jobs moved down to Mexico to employ cheaper labour, creating some tensions between the US and Mexico.
However, Mexico needs to maintain its interests as an oil trader, which involves ensuring no trade war ensues as the majority of their exports go into US markets.
1.2 Global movement of oil and rising tensions among traders
1.2.1 Oil trade routes
The trade of oil is significant in shaping political and economic ripple effects that are sustained by even the slightest of disruptions. The primary use of oil is in industrial manufacturing. However, one of the largest consumer markets for oil includes those that import oil to then refine and export it themselves, creating a chain of production and consumption to the degree of creating international trade deals upon which peace treaties are based. According to Ziv and Rettig (2018), the peace treaties between Israel and Egypt were, among others, premised on oil trade. Figure 1.3.1 shows the movement of oil around the globe, marking major exporters and prominent trade routes. The image also provides a visual comparison of the sizes and distances covered by the trade routes.
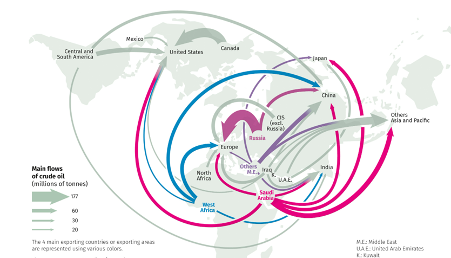
Figure 1.3.1: Oil trade routes. Source: BP, The Statistical Review of World Energy, L’atlas, 2017.
1.2.2 Political tensions between the G20 countries
For geographic and economic reasons, nations trade within their trading communities, buying and selling high proportions of member states’ exports and imports amongst each other (Zhong, Weiqiong, An, Gao, and Sun, 2014). This seems to be motivated by personal economic or political gains, such as in the port of Ceyhan, which is partly protected by the US (Soligo, Ronald, and Jaffe, 2002). The diplomatic relations between countries determine the routes through which oil is transported. However, others indicate a fall in the formation and trade through trade communities (Zhong, Weiqiong, An, Gao, and Sun, 2014).
Common situations among the G20 countries that result in tensions between traders include economic competition created by separately structured economies, such as when a capitalist economy with high labour costs trades with one with relatively lower labour costs. One country flushing excess supply into a foreign market swamps the market at prices at which the domestic producers cannot compete. A nation like Saudi Arabia incurring lower costs of producing oil is advantageous compared to the US which has significantly higher oil production costs.
Another factor contributing to tensions between G20 nations is resource distribution. A loss of comparative advantage reduces a nation’s competitive edge as costs rise, yet these industries still employ large numbers of labour as the risks of higher rates of structural unemployment pressures a government into protectionist policies.
Lastly, currency protection is also a factor contributing to tensions amongst G20 members. Significant fluctuations in the exchange rate (depreciation or appreciation) create imbalances in a country’s balance of payments, especially if fluctuations persist in the long term.
1.2.3 Labour as a core to the cultural tension’s argument China and the US
Labour is one aspect of an economy affected by trade wars, as well as a core reason protectionist policies are put into place. Domestic labour structures and distribution – which is highly dependent on skill levels – determine the effects of international trade on a country.
Labban and Mazen (2014) emphasise an intricate relationship between production – particularly relating to the extraction of the value of labour – and financialisation, exploring the ways in which biopolitical tensions arise. They argue that financialisation “cannot emancipate accumulation from the production (and realisation) of value,” thus being able to only proceed alongside the extraction of value in the labour process (Labban and Mazen, 2014).
1.2.4 Movement of the corporate structure into financialisation
Within the hierarchical organisation of the corporate structure, a relatively new source of “wealth” accumulation emerged following the economic slump of the 1970s: financialisation. This concept involves non-financial corporations diverting investment, particularly revenue-funded, into financial investments, alongside the traditional route of investing solely in the production process. This essentially implies the participation of non-financial corporations in the financial markets (Brenner, 2002, 2006). This creates a unique situation where even within corporations, shares become a form of payment as they become a stable form of wealth accumulation, diversifying the ownership of a firm. Additionally, following the “agency theory”, shareholders exert control over firms through their executives’ allocative roles (Fligstein and Shin, 2007). The pursuit of individual returns becomes more pronounced and less susceptible to political influence. Shareholders and executives favour profit-maximising methods, encouraging trade rather than deterring it. Thus, an unintended outcome of corporate financialisation is a decreased likelihood of trade wars. Increased financialisation drives corporations towards cheaper labour markets, deepening interdependence and amplifying trade disruption consequences.
2.0. BRICS
2.1. BRICS and its Alternatives to the Dollar
BRICS, the economic alliance comprising Brazil, Russia, India, China, and South Africa, stands strong today as a leading alliance poised to reshape the financial landscape. Each of the five BRICS countries is a global developer, contributing to about 32% of the global gross domestic product (GDP) and is expected to contribute more than 50% by 2030. This surpasses the GDP of the G7 countries: the United States, United Kingdom, Canada, Japan, France, Germany, and Italy (Devonshire-Ellis, 2023). In its current position, BRICS members present themselves as prominent decision-makers with significant contributions to global discourse. In the last couple of years, its members have begun considering alternatives to the dollar as the world currency (Chen, 2022). As the dollar’s value wanes in BRICS nations, the prospects for a new global currency grow rapidly.
For situations where balanced trade is a possibility, the effects of BRICS are already being seen. For example, India and the United Arab Emirates (UAE) are considered balanced economies due to India’s agricultural prowess and the UAE’s significant oil deposits. As of July 2023, the UAE has agreed to trade in rupees, rather than dollars, with India (Murphy, 2023). This is a big win for India as it has reduced fees, volatility, and currency weakening associated with dollar-based trades. Other BRICS members, including Russia and China, have adopted their currencies for bilateral trade, notably trading between themselves in Yuan (Chen, 2022).
Furthermore, discussions of a “BRICS currency” backed by gold has surfaced, aiming to rival the US dollar and support balanced and unbalanced trades (Rexaline 2023). Diverse exports from BRICS nations, including agriculture, technology, energy, minerals, and more, facilitate rapid dissemination of the “BRICS currency,” proliferating its use globally (Duhamel, 2022). Additionally, as digital currencies gain momentum, a digital BRICS currency could offer efficient and secure trade options.
As such, digital currencies – including cryptocurrency – present a potential for BRICS nations. Presently, the Central Bank Digital Currency (CBDC) is already a dominion being explored, with reports indicating that 130 countries have agreed to assess its potential use (Atlantic Council, 2023). Meanwhile, the Atlantic Council (2023) also reports that the United States has lagged in developing the CBDC, placing it behind. Similar to CBDCs, a digital BRICS currency could potentially enhance trade efficiency and security.
In either case, whether through the increased use of individual currencies for balanced trade or the adoption of a BRICS currency, all five BRICS members stand to gain significant economic advantages. In addition to being able to use a currency that is unanimously supported by each member, countries could save substantial sums by avoiding dollar transaction fees. The establishment of a “BRICS currency” would strengthen the foreign exchange standings of each BRICS nation relative to the dollar, potentially even challenging US hegemony. This rise in economic influence, significantly enhances the geopolitical and international standing of each state. The heightened political and economic influence of formerly developing countries could lead to unfamiliar implications for international relations and trade. However, their current primary exports alone cannot serve as the sole foundation for creating global superpowers among the BRICS nations.
2.2. Oil as a deciding factor
Oil, being a non-renewable resource, has witnessed escalating demand in numerous economies due to population growth and infrastructure expansion. As a result, several countries are poised to benefit considerably in the years ahead. Figure 2.2 illustrates the largest market share of oil exports.

Figure 2.2 : Largest exporters of oil. Source: The Observatory of Economic Complexity, 2020-2021.
Of the top 15 countries, 2 are founding members of BRICS, while 7 others, namely Iraq, Nigeria, Iran, Kuwait, Kazakhstan, Angola, and Oman, have expressed interest in joining BRICS, potentially resulting in 9 out of 15 major oil-exporting countries adhering to BRICS guidelines.. Furthermore, as crude oil remains a highly valued export, it is likely that trade with these top oil exporters will continue to be dictated by the exports themselves, rather than the buyers (Workman, 2022). While the petrodollar will remain, the specific currency may be remodeled. For example, Brazil has already begun trading oil with China using its own currency, the Brazilian Real (Sharma, 2023).
This means that if a “BRICS currency” were to be introduced, Russia and Brazil would likely adopt it for their trades, including oil. The other 7 major oil-exporting countries awaiting BRICS membership would likely also choose to use the “BRICS currency” or their respective individual currencies, based on guidelines. This could set off a domino effect, leading to a significant increase in the use of the “BRICS currency” or individual currencies, particularly in oil trading. Even in the scenario where the “BRICS currency” is not adopted, the trend of using currencies of the trading countries instead of the US dollar has already begun. Both of these options signify a diminishing reliance on the US dollar, a situation that the world has not seen in over 7 decades.
2.3. Implications and De-dollarisation
The introduction of a “BRICS currency” or the widespread adoption of individual currencies within BRICS nations would have varying impacts on three main groups: the BRICS countries themselves, the United States – which currently holds the gold currency along with the world’s largest gold reserve – and all other countries that do not substantially benefit from either BRICS or the United States.
In the case of de-dollarisation, the BRICS countries would enjoy the advantages of a dominant currency. Although all BRICS members are large exporters, they may experience trade deficits when imports increase due to their central currency. Furthermore, significant geopolitical changes would likely ensue, altering trade patterns and international alliances. While many different variables would contribute to geopolitical shifts, BRICS dominance would enhance their liquidity and efficacy compared to the existing status quo. Moreover, akin to the United States’ present capability, BRICS countries could impose sanctions on other countries, thereby altering trade policies. This newfound economic dominance could empower nations like Russia to implement different, and potentially more impactful sanctions than those of the US. While the US sanctions on Russian oil – triggered by the ongoing Ukraine Crisis – had only a temporary effect, Russian oil exports are already rebounding and potentially surpassing previous levels (Lindeman and Dale, 2023).
For the United States, losing its status as the holder of the primary global currency would be significant. Firstly, the US would have to recover from its ongoing trade deficit since it would no longer have a safety net in place. From the perspective of oil, the US will sustain its own production as well as heavy imports from the Middle East. However, the volatility stemming from the United States having to revalue the dollar and adapt to new currencies is likely to affect the overall economic performance of the US (Papa, 2023). Additionally, with US sanctions and policies no longer having as much of an impact, the US will have to learn to deal with other countries based on more balanced conditions, a situation it has not encountered in years. After the recent collapse of Silicon Valley Bank, the US economy has already experienced a setback, underscoring the necessity of preventing similar instances in the event of de-dollarisation (Ali, 2023). Furthermore, the United States will experience repercussions in relation to its debt. A diminished dollar value will result in fewer takers for US debt, leading to greater challenges and prolonged timelines for debt repayment. This shift will also substantially alter the debt-to-GDP ratios, making borrowing more tedious.
For countries not part of the BRICS group or the central banks of the United States, there is a likelihood that central banks will revise their strategies for currency management, including decisions regarding interest rates and personal policies. Such changes by central banks would reflect the policies of individual countries, just as they do today. Private banks are also likely to adjust their pricing to align with the “BRICS currency” or whichever predominant currency they engage in trade with. This will result in fluctuations in economic factors like exchange rates for individual countries, possibly leading to geopolitical tensions. At the very least, countries will need to realign their strategies, gravitating towards the guidelines of the country from which they derive the most economic value, which is most likely to be the BRICS nations.
Just as the post-World War II era witnessed a significant transition from the dominance of the United Kingdom to that of the United States, the world may once again face unforeseen consequences. De-dollarisation is a likely future, whether or not a “BRICS currency” materialises, and all countries, including those within the BRICS consortium and the United States, must be ready for change.
3.0. The Russia-Ukraine Conflict
3.1. Changes in oil and gas trade as a result of the Russia-Ukraine conflict
Since Russia’s invasion of Ukraine on the 23rd of February 2022, the world has seen major shifts in terms of supply chain and price fluctuations in key markets. Particularly, one year after Russia’s invasion of Ukraine, the global energy landscape has changed dramatically. Various regions worldwide have experienced soaring prices that have placed a considerable burden on consumers, all against the backdrop of a geopolitical context centred around energy security. Furthermore, the world’s dependence on fossil fuel consumption, along with the associated price volatility and resources uncertainties, has become a focal point.
At the outset of the conflict, according to the IEA, Russia ranked among the top three global crude producers, contending with Saudi Arabia and the United States for the leading position. Additionally, as the world’s second-largest natural gas producer, trailing only the United States, the sanctions imposed on Russia have had significant implications for international trade (IEA, 2022). Consequently, several of Russia’s gas and oil exports have come to a halt, with many European countries drastically reducing their reliance on Russian supplies. Moreover, with the Versailles Declaration agreed in March 2022, the leaders of the 27 EU member states agreed to phase out the EU’s dependence on Russian fossil fuels. Subsequently, in May 2022, the European Council agreed on a ban on almost 90% of all Russian oil imports to take effect by the end of 2022 (Council of the European Union, 2023). Despite efforts to redirect energy towards Asian markets, including projects such as The Power of Siberia natural gas pipeline aimed at supplying increasing amounts of gas to China, Russia has experienced a decline in its global energy market share, especially in the natural gas sector (Kuczyński, 2023). Despite these shifts in global trade dynamics, energy prices have either matched or fallen below pre-war levels.
3.2. Gas Trade
In 2021, Russia accounted for around 24% of global gas trades, with its exports (excluding those to former Soviet Union countries) declining by approximately 45% in 2022, amounting to 100.9 bcm. Furthermore, analysts expect a decrease in total Russian gas exports to around 50–65 bcm in 2023 (excluding supplies to China), leaving more than 100 bcm to be redirected elsewhere (Jordan and Husbands, 2023).
Before the conflict, in 2021, the EU imported more than 69.6% of all Russian gas exports, with just over 3.15% imported by China through the newly-developed Power of Siberia gas pipeline (Figure 3.2). The nation also supplied gas through the form of LNG shipments, constituting a total of 16.5% of all exports. Moreover, approximately 45% of imports and nearly 40% of gas demand within the European Union relied on Russian natural gas (IEA, 2022). This proportion had been on the rise due to declining domestic natural gas production within Europe itself. The primary importers of Russian natural gas were Germany, Turkey, and Italy (IMF 2022). Currently, gas poses a greater challenge compared to oil in discovering new markets due to its specialised infrastructure demands.

Figure 3.2 – Chart illustrating Russian gas exports by year, since 2010. Source: Infogram, 2021, https://infogram.com/destinations-of-russian-pipeline-gas-and-lng-exports-from-2010-onwards-1h7k230gw8x0v2x
3.2.1 Gas exports to EU
Despite the new sanctions imposed on Russia, primarily involving trade restrictions, gas prices within the EU have fallen to pre-war levels, with the current import price in the EU aligning with that of June 2021. Despite the EU’s trade restrictions, including substantial reductions in Russian energy supplies to countries such as Germany (a reduction of 91%) and an EU-wide commitment to phase out dependence on Russian fossil fuels at the earliest opportunity, the Union’s gas demand has, in fact, fallen (European Council, 2023).
According to the Executive Director of the IEA, Fatih Birol, support schemes for renewables, grants, preferential loans for housing retrofits, heat pump installations, and campaigns promoting behavioral changes have collectively contributed to moderating gas demand. The power sector is the only domain in which gas demand exceeded 2021 levels, mainly due to changes spurred by renewables, particularly wind and solar energy. Thanks to ongoing policy support for renewables, around 50 GW of wind and solar was installed in the European Union in 2022, a record high. These additions avoided the need for around 11 bcm of natural gas in the power sector, the single largest structural driver of reduced natural gas demand. In contrast, the sharp year-on-year declines in both nuclear and hydropower output pushed up demand for gas-fired power, leading to a small overall net increase in gas demand in the power sector (Zeniewski, Molnar, Hugues, 2023).
Beyond the power sector, both the building and the industry sectors used less gas due to several factors. For instance, in 2022, the building sector required 28 bcm less natural gas than in 2021 (IEA, 2023). Warmer meteorological conditions resulted in 12% less energy being needed for household heating, shifting behaviour, improving energy efficiency, and ultimately reducing demand. Moreover, within the industrial sector, gas consumption fell by 25 bcm, equating to a reduction of around 25%, due to production curtailment and changes in fuel usage.
Various factors have caused a 13% decline in natural gas demand over one year. Some factors were transient in nature (price-sensitive fuel switching and weather effects, for example) while others were structural (renewable capacity additions, efficiency improvements, and heat pump sales, for instance), leading to lasting reductions in demand. Undesirable structural changes, such as permanent factory closures, also played a role. Mid-course changes such as voluntary demand reduction and import substitutions may not persist if gas markets rebalance and prices revert to historical averages (IEA, 2023).
Despite the significant decline in demand, the EU’s expenditure on gas imports reached nearly EUR 400 billion in 2022, more than triple the 2021 level). Russia’s share of EU gas demand declined from 40% in 2021 to below 10% by the end of 2022, yet the sharp price increase still ensured substantial income for the state in 2022. Gas prices have since decreased (Figure 3.2.1), and Russia’s Ministry of Finance reported a decrease of over 40% in natural gas revenues in the initial two months of 2023 in comparison to the same period in 2022 (IEA, 2023).
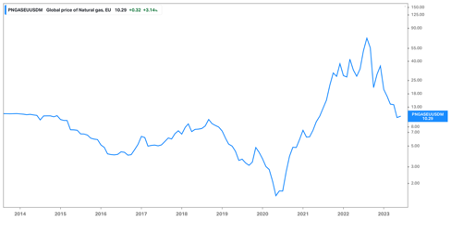
Figure 3.2.1 – Graph illustrating the price movement of gas in the EU since 2014. Source: Koyfin, 2023, https://app.koyfin.com/charts/g/ec-k3ruh7
3.2.2 New markets for Russian gas
Russia’s largest gas producer, Gazprom, faces challenging choices to replace the loss of its traditional European pipeline markets, including options such as waiting for European gas buyers to return in the future, expanding pipeline gas supply to China and other non-sanctioned countries, and expanding the LNG business. It is projected that a significant portion of the gas curtailment will be redirected to China, facilitated by the expansion of both existing and new pipeline infrastructure. The Power of Siberia I is expected to supply about 22 bcm of gas to China in 2023, eventually reaching the full capacity of 38 bcm in 2025. Construction of Power of Siberia II, with an estimated capacity of approximately 50 bcm, is set to commence in 2024, with transportation starting in 2030 (IEA, 2022). However, critical factors such as pipeline costs (estimated to exceed $10 billion) and gas purchase prices remain subjects of negotiation, with China yet to commit to the project. Other European markets, such as Turkey, Serbia, and Hungary have expressed interest in pipeline gas, although their scale is relatively modest in comparison to the lost market (Jordan and Husbands, 2023).
Despite these efforts, a surplus of over 50 bcm is anticipated, and it remains doubtful whether LNG sales can fully offset this excess. Expanding LNG capacity necessitates significant investments in liquefaction and shipping, along with time and technical expertise for construction (Jordan and Husbands, 2023).
3.3. Oil Trade
Prior to the invasion of Ukraine in 2022, approximately 53% of Russia’s global oil exports consisted of crude oil, while approximately 54% comprised oil products, and the majority of these exports were destined for Europe (Jordan and Husbands, 2023). However, in the aftermath of the invasion and the subsequent imposition of EU sanctions and commitments to diminish Russian imports, Russia had to seek alternative markets for its oil and oil products.
Between January 2022 and January 2023, Russia succeeded in redirecting its oil and oil product sales away from Europe and the US, both of which were significantly affected by the sanctions. Instead, they redirected their exports predominantly towards India, and to a lesser extent, China and Turkey. This shift allowed them to manage the transportation of oil and oil products to these new markets relatively easily.
As a result of this diversification, Europe’s share of Russian oil exports dramatically declined to approximately 8% by February 2023, a significant decline from the over 50% share it held in 2021. As of June 2023, data from CREA and Bloomberg suggests that EU oil imports continue to dwindle as countries seek to further reduce their reliance on Russian supplies. On the other hand, several countries outside the EU have increased their purchases of Russian oil, with India, the world’s third-largest oil consumer and importer, relying on Russia for 40% of its crude supplies (Verma, 2023).
The two major routes for exporting crude oil involve pipelines and oil tankers at sea. The Druzhba pipeline system carries oil to the EU, while the ESPO pipeline carries oil to China. Remaining Russian crude oil has historically been exported by sea to the EU, China, and to a lesser extent, other countries.
From December onwards, imports, particularly via the northern branch of the Druzhba pipe, had been falling and were expected to reduce further in the early months of 2023, with Germany and Poland halting purchases. Conversely, flows through the Southern branch were expected to continue. In total, approximately 0.92 million tons of crude were transported via the pipeline, a drastic fall from the 3.32 million tons of February 2022. In contrast, exports via the ESPO pipeline (part of Russia’s broader energy pivot to Asia, aimed at shifting export dependence away from Europe, remained steady. Additionally, seaborne exports to the EU decreased from 7.54 million tons in February 2022 to a mere 1.31 million tons in May 2023 (Guetta-Jeanrenaud, 2023).
According to the IEA, Russian total oil exports, in terms of volume, experienced a slight increase in 2022 compared to 2021, rising from 8 million barrels per day to 8.1 mb/d. Exports to the EU decreased from 3.9 mb/d to just 1.3 mb/d. Figure 3.3 illustrates a trend of oil prices returning to pre-war levels. In response to this trend, Russia has made the decision to cut its supply in an attempt to raise prices.
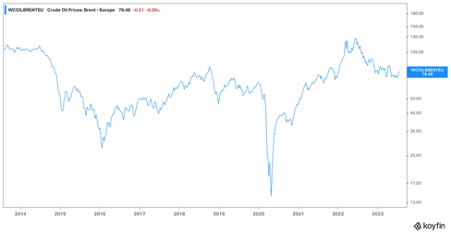
Figure 3.3 – graph of oil price movement, in Brent, since 2014 https://app.koyfin.com/charts/g/ec-jv06v4 Source: Koyfin, 2023
3.4. Effects on Russian economy
Historically, the Russian economy was heavily reliant on Gazprom’s profitability, with the company being the largest contributor to the state’s finances in 2022. However, in the past six months, Gazprom’s profits have dwindled due to reduced European gas demand and falling prices (Jordan and Husbands, 2023).
To bridge the gap in the European market, Gazprom faces two options: pipeline gas exports to China or increase LNG exports. However, both choices necessitate substantial investments and a timeframe of 5-7 years for infrastructure expansion, which may still prove insufficient. With Gazprom’s reduced revenues and the potential for increased state taxes, financing this shift remains uncertain.
This reliance on Gazprom’s profitability has significant economic and political implications, jeopardising Russian state finances and raising concerns about funding the war against Ukraine amidst the expected decline in gas revenue.
4.0. Final Remarks
4.1. Conclusion
Given the evolving borders and ever-changing geopolitical circumstances, every nation must remain prepared for changeOil, being the valued commodity it is, stands at the forefront of this change, underscoring the importance of keeping a watchful eye on it. The G20 countries encompass a spectrum of diverse economic and socio-political situations, even within the realm of oil trade. Thus, they present a vivid portrayal of modern trade and its implications on different aspects of a nation. Through oil trade routes and agreements such as NAFTA, established strongholds may shift, impacting the resilience of trade routes and negotiations and subsequently influencing socio-political outcomes. Furthermore, the rising influence of the BRICS nations pose a growing foothold for currencies in the context of oil trade. This could lead to de-dollarisation, bringing about significant changes for numerous economies. Additionally, the ongoing and notable crisis of the Russia-Ukraine conflict introduces its own complexities. With Russia rapidly facing volatility in its oil markets, its economy is altering, which will further exert geopolitical repercussions, including those involving Ukraine. All these scenarios serve as a warning to prepare for the implications of oil trade in the years to come.
References
Aizhu, C. “Vast China-Russia Resources Trade Shifts to Yuan from Dollars in Ukraine Fallout.” Reuters, 11 May 11 2023. https://www.reuters.com/markets/currencies/vast-china-russia-resources-trade-shifts-yuan-dollars-ukraine-fallout-2023-05-11/#:~:text=Russian%20President%20Vladimir%20Putin%20has,first%20four%20months%20of%202023
Ali, H., Aysan, A. F., and Yousef, T. M. “From Tech Hub to Banking Failure: Exploring the Implications of Cbdcs on the Destiny of Silicon Valley Bank.” Qeios, 7 April 2023. https://www.qeios.com/read/DQGGO7
Atlantic Council. “Central Bank Digital Currency Tracker.” Atlantic Council, 14 July 2023. https://www.atlanticcouncil.org/cbdctracker/
Brenner, R. (2002) The Boom and the Bubble: The US in the World Economy. London: Verso
Brenner, R. (2006) The Economics of Global Turbulence. London: Verso
“Crude Petroleum | OEC.” n.d. OEC – the Observatory of Economic Complexity. https://oec.world/en/profile/hs/crude-petroleum
“Destinations of Russian Pipeline Gas and LNG Exports from 2010 Onwards – Infogram.” n.d. Infogram.com. Accessed 4 August 2023. https://infogram.com/destinations-of-russian-pipeline-gas-and-lng-exports-from-2010-onwards-1h7k230gw8x0v2x
Devonshire-Ellis, C. “The BRICS Has Overtaken the G7 in Global GDP.” Silk Road Briefing, 27 March 2023. https://www.silkroadbriefing.com/news/2023/03/27/the-brics-has-overtaken-the-g7-in-global-gdp/
Dudley, B. “BP statistical review of world energy 2016.” British Petroleum Statistical Review of World Energy, Bplc. editor, Pureprint Group Limited, UK (2019).
Duhamel, C. “Intra-Brics 2022 Trade.” Silk Road Briefing, 17 November 2022. https://www.silkroadbriefing.com/news/2022/11/17/intra-brics-2022-trade/
Ediger, V. Ş. and Berk, I. “Crude oil import policy of Turkey: Historical analysis of determinants and implications since 1968.” Energy Policy 39, no. 4 (2011): 2132-2142.
Ernst, E., Merola, R., and Samaan, D. Trade wars and their labour market effects. International Labour Office, 2019.
“Europe’s energy crisis: What factors drove the record fall in natural gas demand in 2022?” IEA. 14 March, 2023. https://www.iea.org/commentaries/europe-s-energy-crisis-what-factors-drove-the-record-fall-in-natural-gas-demand-in-2022.
Fattouh, B., and Sen, A. “Saudi Arabia oil policy: More than meets the eye?.” (2015).
Fligstein, N. and Shin, T. (2007) Shareholder value and the transformation of the US economy 1984–2000. Sociological Forum 22(4): 399–424
“Koyfin | Advanced Graphing and Analytical Tools for Investors.” n.d. Koyfin.com. https://app.koyfin.com/charts/g/ec-k3ruh7.
“Koyfin | Advanced Graphing and Analytical Tools for Investors.” n.d. Koyfin.com. https://app.koyfin.com/charts/g/ec-jv06v4
Labban, M. “Against value: Accumulation in the oil industry and the biopolitics of labour under finance.” Antipode 46, no. 2 (2014): 477-496.
Lindeman, B. and Dale, I. “Sanctions on Russia May Not Be Working, We Now Know Why.” Russia-Ukraine war | Al Jazeera, 5 June 2023. https://www.aljazeera.com/opinions/2023/6/5/sanctions-on-russia-may-not-be-working-we-now-know-why
Murphy, D. “India and UAE Agree to Trade in Rupees Instead of Dollars.” CNBC, 17 July 2023. https://www.cnbc.com/video/2023/07/17/india-and-uae-agree-to-trade-in-rupees-instead-of-dollars.html#:~:text=The%20move%20could%20boost%20India%27s%20efforts%20to%20cut%20transaction%20costs
“Oil Trade, 2016.” n.d. Espace-Mondial-Atlas.sciencespo.fr. Accessed 3 August 2023. https://espace-mondial-atlas.sciencespo.fr/en/topic-resources/map-5C27-EN-oil-trade-2016.html
Papa, M. and The Conversation. “How Long Will the Dollar Last as the World’s Default Currency? The BRICS Nations Are Gathering in South Africa This August with It on the Agenda.” Fortune, 25 June 2023. https://fortune.com/2023/06/25/dollar-reserve-currency-brics-brazil-russia-india-china-south-africa/
Rexaline, S. “Why Brics Currency Will Devalue Dollar, Other Fiat Currencies.” Benzinga, 8 July 2023. https://www.benzinga.com/markets/asia/23/07/33155604/brics-gold-backed-common-currency-a-shock-to-global-fiat-money-system-says-economist-as-russia-confi
Rubinovitz, Z. and Rettig, E. “Crude peace: The role of oil trade in the Israeli-Egyptian peace negotiations.” International Studies Quarterly 62, no. 2 (2018): 371-382.
“Saudi Arabia: Staff Concluding Statement of the 2023 Article IV Mission.” n.d. IMF. https://www.imf.org/en/News/Articles/2023/06/06/saudi-arabia-staff-concluding-statement-of-the-2023-article-iv-mission#:~:text=Saudi%20Arabia%20was%20the%20fastest.
“World Bank Open Data.” n.d. World Bank Open Data. Accessed 3 August 2023. https://data.worldbank.org/indicator/NY.GDP.MKTP.KD.ZG?end=2022&locations=AE&start=2022&view=bar
Sharma, U. “Drubbing the Dollar: China and Brazil Ditch Dollar, Strike Deal to Settle Trade in Yuan, Real.” Firstpost, 30 March 2023. https://www.firstpost.com/world/drubbing-the-dollar-china-and-brazil-ditch-dollar-strike-deal-to-settle-trade-in-yuan-real-12377602.html#
Soligo, R. and Jaffe, A. M. “The economics of pipeline routes: the conundrum of oil exports from the Caspian basin.” In Energy in the Caspian Region: Present and Future, pp. 109-132. London: Palgrave Macmillan UK, 2002.
Workman, D. “Countries.” Top US Exports 2022, 2022. https://www.worldstopexports.com/united-states-top-10-exports/
Worldometer. 2016. “Saudi Arabia Oil Reserves, Production and Consumption Statistics – Worldometer.” Www.worldometers.info. 2016. https://www.worldometers.info/oil/saudi-arabia-oil/
Zhong, W., An, H., Gao, X., and Sun, X. “The evolution of communities in the international oil trade network.” Physica A: Statistical Mechanics and its Applications 413 (2014): 42-52.


