
Abstract
Oculomics refers to the study of ocular biomarkers that reflect systemic disease. By employing artificial intelligence (AI), particularly deep learning algorithms, retinal imaging can be analysed to detect early signs of cardiovascular, renal and neurodegenerative disorders, offering a non-invasive, rapid and promising approach to clinical screening. This review aims to synthesise the existing literature regarding the use of oculomics as an application of deep learning to screen for said systemic diseases. Analysis of microvascular abnormalities through retinal imaging offers an insight into the cardiovascular condition of the rest of the body. The utility of artificial intelligence in analysing retinal images to diagnose and screen for cardiovascular disease (CVD) in populations globally offers a robust method to assess CVD status in individuals. Current chronic kidney disease (CKD) screening methods are invasive and often miss early-stage CKD, a disease that is prominent globally. Non-invasive AI models using retinal images improve risk stratification. The Reti-CKD score exemplifies this, with concordance index improvements of 0.020 (UK Biobank) and 0.024 (Korean cohort). Advances in retinal imaging such as OCTA provide high-resolution retina scans, and the AI models (CNN, Eye-AD, etc.) for such scans can detect the subtle microvascular and neuronal biomarkers of neurodegenerative diseases. Oculomics is an emerging field of systemic disease screening using retinal images and deep learning methods of image analysis. Despite the potential for systemic disease screening with AI, it has limitations including a reliance on high image quality, small datasets and algorithmic bias. Further research is required to evaluate its real-world effectiveness, implementation into existing clinical workflows and cost-effectiveness.
Introduction
Oculomics, a term first introduced in 2020, refers to the use of retinal imaging to derive biomarkers that reflect systemic health (1). The retina is uniquely positioned as a “window to the body” because it provides direct, non-invasive access to microvasculature and neural tissue, which are otherwise difficult to visualise in vivo (2). Advances in ophthalmic imaging, particularly colour fundus photography and optical coherence tomography (OCT), have enabled the capture of high-resolution images of retinal structures. Deep learning (DL), a subset of artificial intelligence (AI) that uses layered neural networks to automatically identify complex patterns in large datasets, has further advanced this field. By applying DL and other AI approaches, subtle patterns in these images can be detected and quantified. These features may correspond to risk factors or disease states in cardiovascular, neurological, renal and metabolic systems (3, 4).
DL models, particularly convolutional neural networks (CNNs) and transformer-based architectures, process raw ocular images and identify complex patterns beyond human recognition. These models can predict demographic factors such as age and sex, estimate physiological measurements like blood pressure and screen for systemic diseases including coronary artery disease, Alzheimer’s disease and chronic kidney disease (CKD) (5, 6). In essence, oculomics combines imaging (hardware), population-scale datasets (big data) and AI (software) to transform the eye into a diagnostic gateway for general health (2).
The value of oculomics lies in its potential to revolutionise systemic disease screening by offering a rapid, non-invasive and scalable diagnostic tool. Traditional methods of assessing systemic diseases often require invasive procedures, specialised equipment or costly imaging modalities such as CT or MRI. In contrast, retinal imaging is relatively inexpensive, widely available and easily performed in outpatient or community settings. When combined with AI, oculomics can provide immediate risk stratification and predictive insights, making it suitable for large-scale population health screening (3). Furthermore, oculomics supports the paradigm shift toward personalised and preventive medicine. For example, DL models applied to retinal photographs can predict cardiovascular risk with accuracy comparable to conventional risk scores (3, 4). Similarly, retinal imaging has been used to detect cognitive impairment and early-stage Alzheimer’s disease, conditions where early intervention is critical but diagnosis remains challenging (5).
By enabling earlier detection of systemic diseases, oculomics has the potential to reduce disease burden, guide timely interventions and improve health outcomes (2). Retinal cameras are increasingly portable and can be deployed in low-resource settings, while cloud-based AI systems allow remote image interpretation. This democratises access to advanced diagnostics and may help reduce disparities in healthcare delivery. As healthcare systems worldwide face rising demands from chronic diseases, oculomics offers a cost-effective and scalable approach to early detection and risk prediction (7, 8).
The concept of the eye as a reflection of systemic health is not new. In the mid-19th century, the invention of the ophthalmoscope allowed physicians to observe the retina directly, linking retinal vessel abnormalities with hypertension and systemic disease (9). By the late 20th century, digital fundus photography and OCT enabled objective, high-resolution imaging of the retina, making large-scale epidemiological studies possible. Cohort studies such as the Atherosclerosis Risk in Communities (ARIC), Rotterdam Study and Blue Mountains Eye Study provided robust evidence that retinal features correlate with cardiovascular, renal and neurological outcomes (10, 11, 12). The 2000s to early 2010s saw the introduction of semi-automated software tools, such as IVAN and SIVA, which quantified retinal vessel calibre and tortuosity (13, 14). While these systems improved standardisation, they required time-consuming input from human graders.
The major breakthrough arrived around 2015, with the application of deep learning to retinal image analysis. Landmark studies by Google Health and others demonstrated that CNNs could predict cardiovascular risk factors, including smoking status, age and blood pressure, directly from fundus photographs with remarkable accuracy (3). Since then, the field has rapidly evolved. Advances in AI architectures, such as vision transformers and foundation models (e.g., RETFound), have enabled multimodal integration of retinal images with systemic health data, improving generalisability across populations (15). Meanwhile, the availability of massive datasets like the UK Biobank has accelerated training and validation of these models (16). Today, oculomics represents a convergence of ophthalmology, artificial intelligence and systemic medicine, with ongoing research aiming to validate its role in real-world clinical practice (2).
Many systemic disorders that affect a large amount of the world’s population are reflected in the eye (2). Changes in microvasculature structures in the retina can be predictors for diabetes, hypertension, coronary disease, renal disease and stroke. Additionally, retinal nerve fibre layers and macular volume can be assessed for alterations in thickness to highlight individuals at risk for developing cognitive decline and neurodegenerative disease (1).
Although detecting systemic disease related to cardiovascular disease (CVD), diabetes and cognitive decline through oculomics shows the most promise today, advances in identifying a variety of disorders are continuingly being made: for example, in kidney disease and sickle cell anaemia (1). With the help of AI algorithms, oculomics is set up to be an invaluable tool in the field of medicine that extends beyond eye care.
Oculomics has the potential to be utilised by a broader variety of professionals such as general practitioners (GPs), cardiologists, neurologists and other specialists related to a breadth of systemic conditions (2). AI in oculomics has demonstrated extreme promise by enhancing diagnostic accuracy, enabling earlier detection of disease, increasing efficiency and streamlining patient management (2, 9). The role of AI in oculomics, especially the role of deep learning models, brings into picture the possibility of an extension beyond simple risk prediction from retinal images into more advanced diagnosis.
In order to combat the issue of limited interpretability, methods such as saliency maps and highlighting pixels can be used to help healthcare professionals see how an AI algorithm came to a certain conclusion (1). Today, only a select few oculomics related AI algorithms have undergone the external validation necessary to receive the approval to be used in a clinical setting (2). Some important considerations when moving forward with the clinical implementation of algorithms related to oculomics include economic value, safety, efficiency and acceptability (17). Additionally, clinically implementing these innovative technologies requires more than technological advancements; it also depends on the adaptability of the technology within clinical environments, acceptability among both the professionals using the technology and the patients, and workflow integration (2).
Recent progress made in the field of oculomics makes clinical implementation closer than ever, but ethical considerations have to be taken into account. Developing and training AI algorithms to identify systemic disease based on eye scans requires vast amounts of real data (2). This raises two general ethical concerns relating to privacy and equity. Firstly, data bias and issues connected to representation of different populations could result in inaccurate results if the AI algorithm is not trained on a diverse dataset (1). For example, an oculomics AI model trained on a Korean population showed lower performance when externally validated on the UK Biobank dataset, which is composed of predominantly Caucasian individuals (2). For this reason extensive validation across diverse populations is essential before clinical implementation (2). Secondly, the need for large amounts of data to train algorithms raises the concern of data breaches, misuse of personal data and unauthorised and unconsented access to data which could lead to ethical dilemmas (17). Additionally, in the result of the AI making an error that harms a patient, it is unclear where the responsibility lies, whether that be with the developer, hospital or clinician who uses the AI (2). For these reasons, proactively addressing ethical challenges is essential for the responsible implementation of oculomics into clinical practice (2).
The future of oculomics has the potential to provide a revolutionary opportunity to reshape healthcare and provide a non-invasive, efficient and cost effective way to diagnose systemic disease and, if crucial steps towards preventing bias and contributions to the wealth disparity gap are taken, could successfully serve low-resource communities (2).
I. Cardiovascular Disease Screening with Oculomics
CVD is viewed as a range of conditions that affect the heart and blood vessels, including coronary heart disease, stroke and heart failure, along with other afflictions. Common causes of CVD include high blood pressure, high cholesterol and smoking, which may develop atherosclerosis, a plaque build-up in the arteries. Hypertension, a condition of CVD, stems from a high-sodium diet, excessive alcohol consumption, obesity and stress. Although millions of people are diagnosed with heart attacks or strokes each year, CVD often begins decades earlier, progressing silently and remaining undetected until it causes irreversible harm. This silent progression makes early detection and intervention critically important, and understanding its various forms and associated risk factors is essential for both prevention and effective treatment.
According to the British Heart Foundation, approximately one in 12 people globally are living with some form of CVD (18). The World Health Organization found that the leading cause of death worldwide is CVD, resulting in 17.9 million deaths annually (19). Globally, CVD is a significant factor in disability and reduced quality of life among those affected. Not only does someone’s day-to-day life change but they can take on a high economic burden, as do healthcare systems globally in trying to screen and monitor patients with, and at risk of, disease. It is therefore critical for patients to visit a healthcare professional to be tested for CVD, especially because CVD develops gradually and early detection allows for prevention or a delay of serious events.
Limitations exist in traditional screening for risk factors, which include changes in blood pressure, high cholesterol, smoking and diabetes. These limits range from not detecting an early or silent disease, requiring multiple visits and even the need for blood tests. On a global scale, it is important to consider that screenings may not be accessible in low-resource settings. Retinal imaging, which provides valuable insights into the body’s internal health, may offer a solution to current limitations. The retina provides a direct view of microvascular structures, which mirror the microvascular condition of the rest of the body. Similarly, retinal blood vessels reflect systemic vascular health. Correlating to CVD, retinal changes such as arteriolar narrowing and haemorrhages are associated with hypertension, atherosclerosis and the risk of a stroke. Retinal imaging is the non-invasive, more effective way to scan an individual.
Oculomics is the study of eye data from retinal images to diagnose for specific conditions, as microvasculature in the retina reflects systemic health. Oculomics may be augmented by the use of AI to extract features from retinal images that correlate with age, blood pressure, smoking status and risk of a stroke or heart attack. Oculomics may be the future of screening for CVD, as it is non-invasive and a fast scan with immediate results, potentially more accessible and cost effective, and may be integrated into existing eye exams. Therefore, oculomics may improve risk prediction beyond traditional CVD screening models.
The integration of AI into the process of analysing retinal images to diagnose the CVD status of individuals is a rising field in oculomics. The use of machine learning (ML) and DL in AI models enable learning through pattern recognition, using large quantities of retinal image data with the corresponding CVD status associated with the images (20). ML consists of artificial neural networks (ANNs) in various network layers, including an input layer, an output layer and possibly hidden layers which process non-linear patterns. DL is a type of ML that consists of more advanced neurons that are capable of increasingly complex functions, consisting of complex neural architectures and networks to facilitate AI learning with greater independence than ML models (21). AI models, particularly DL models, which are trained to recognise abnormalities in microvascular structures in the eye, may potentially be more efficient and advantageous for CVD screening when compared to present methods.
Indeed, various studies have demonstrated improvements in CVD screening using AI algorithms in comparison to current tools. One study, which developed an AI model to identify risk factors based on retinal images, such as age, sex, blood pressure and cholesterol levels, found that the model achieved an area under the receiving operating characteristic curve (AUROC) of 0.971 for borderline-risk for CVD and 0.976 for intermediate- and high-risk for CVD (22). Another study found that their DL-based score, RetiCVD, identified Pool Cohort Equation (PCE)-based intermediate- and high-risk CVD with a sensitivity of 82.7%, QRISK3-based intermediate- and high-risk patients with a sensitivity of 82.6% and modified Framingham Risk Score (FRS)-based intermediate- and high-risk CVD with a sensitivity of 82.1% (23). Other studies have demonstrated minor and major improvements when compared to current assessment tools, such as the PCE, QRISK3 and FRS. One such study demonstrated an AUROC improvement of 0.031 when using their AI-based score RetiCAC (coronary artery calcium) when compared to the PCE-based scores (24). This same research group validated the RetiCAC model and found an AUROC improvement of up to 0.023 when compared to the QRISK3-based scores (25). Another group found that a multimodal DL model, which integrated analysis of both retinal images and risk factors, achieved an AUROC of 0.872 to determine the prevalence of CVD – a significant improvement when compared to the AUROC of 0.677 of the PCE scores (26, 27, 28).
AI models, through analysis of retinal photographs, offer a potentially cost-effective and non-invasive method to screen for CVD in various populations. AI tools can improve the accessibility of CVD screening tools and can offer a comprehensive evaluation of a patient’s health during a routine appointment with a quick, simple test at the point-of-care. However, various limitations exist that hinder widespread clinical application. Current studies demonstrate results that may not be generalisable for certain populations, as AI models are only capable of applying information in a clinical setting based on the information they are trained on. For example, models that were trained on a risk factor profile of a population of one ethnicity may not be applicable to patients of different ethnicities (23, 27).
Due to a lack of exploration in clinical applications, such as the variance in quality of images, patient profiles or other sources of heterogeneity, studies may not be able to accurately replicate results in a clinical setting. Furthermore, AI models may not offer considerable improvement compared with current screening tools, and some studies report minor or no improvement when using an AI model to screen for CVD (29). Finally, current datasets and sample sizes may not be large enough to accurately predict the potential utility and accuracy of AI in a clinical setting (27). Therefore, further research into the integration of AI models in oculomics is required in order to increase generalisability, applicability, accuracy and reproducibility of results to implement effective AI models in healthcare settings globally.
II. Chronic Kidney Disease Screening with Oculomics
CKD is defined as: “abnormalities of kidney structure or function, present for >3 months, with implications for health”. This disease is typically accompanied by a decline in excretory, endocrine and metabolic functions. Since most causes of CKD are irreversible, treatment is aimed at slowing its progression to kidney failure (30). This means that prevention is key to decreasing mortality. CKD is a prevalent condition, affecting 850 million people worldwide (31), which translates to more than 10% of the global population (32).
The five types of CKD are displayed in the following table:
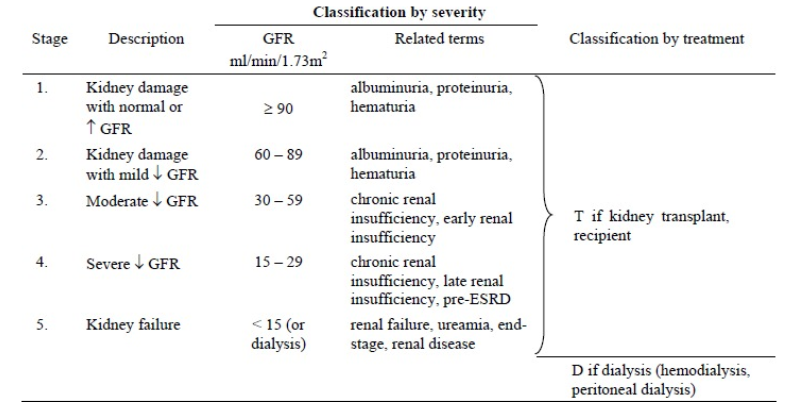
Table 1: Classifications of CKD based upon eGFR (33).
CURRENT METHODS OF DIAGNOSIS
The simplest screening test for CKD is standard dipstick testing. “The presence of albumin in the urine predicts both cardiovascular and non cardiovascular morbidity as it reflects a generalised endothelial dysfunction” (34). The estimation of the glomerular filtration rate (GFR) is the “best overall indicator of the level of kidney function” (34). Glomerular filtration is one of the various functions of the kidney. GFR is assessed by “measurement of plasma or urinary clearance of exogenous filtration markers (referred to as mGFR), or more commonly, serum concentrations of endogenous filtration markers and demographic factors as surrogates for their non-GFR determinants (referred to as eGFR)” (35). The standard method for obtaining eGFR values is a simple blood test. Commonly, creatinine levels are measured, which allows for the kidney’s function to be tracked since creatinine is a “waste product that comes from the digestion of dietary protein and the normal breakdown of muscle tissue” (36). Kidney biopsies are often used since they “provide prognostic information that may result in treatment modification in up to 74% of patients” (37).
THE FUTURE OF DIAGNOSIS
The kidney and eye are both highly vascularised organs and “share common developmental, physiological and pathogenic pathways”; damage to one organ “often indicates damage to the other” (38). Individuals displaying retinal microvascular signs, including “retinopathy, arteriolar narrowing and venular dilatation exhibit an increased predisposition for CKD, and vice versa” (32).
Investigating non-invasive methods is important since these tools “serve as valuable prognostic tools, allowing for better risk assessment and improved patient management” (39). These tools are simple and cost-effective. Non-invasive models could “improve CKD clinical management, particularly for those who are ineligible for biopsies” (31). Furthermore, kidney damage is difficult to predict, “especially in people without blood or urine test abnormalities”. Recently, an AI application was “shown to be capable of providing biomarker estimates, including creatinine, which also led to effective detection of prevalent CKD” (38).
As AI has developed and began to show signs of playing a significant role in the field of medicine, “several challenges are emerging, such as the black box characteristics of AI models and data privacy and bias issues” (40). These issues must be acknowledged and addressed for AI to be responsibly embraced by healthcare providers.
KEY TERMS
- AUC stands for “area under the curve”. Its calculation is a “way to quantify how well the logistic regression model does at classifying data”. A value of 1 can “perfectly classify observations into classes while a model that has an AUC of 0.5 does no better than a model that performs random guessing” (41).
- Retrospective study “look backwards at data that has already been collected or generated to answer a scientific (usually medical) problem” (42).
- Prospective study “identifies a scientific (usually medical) problem to be studied, specifies a study design protocol (e.g. what you’re measuring, who you’re measuring, how many subjects, etc.) and then gathers data in the future in accordance with the design” (42).
- Concordance index is a measure of how well a model ranks individuals by risk of an event (46).
- Cox proportional hazards model is used to evaluate how different factors affect the time until an “event” (like developing CKD) (45).
A NON-INVASIVE MODEL FOR CHRONIC KIDNEY DISEASE SCREENING (31)
Wu et al. aimed to develop a “noninvasive model for early detection, pathological diagnosis and long-term prognosis prediction of CKD using retinal images or in combination with clinical data” (31).
The Kidney Intelligent Diagnosis System (KIDS) was developed using 13,144 retinal images from 6,773 participants. “Based on deep learning (DL) algorithms, qualitative associations [were] established between ocular features and systemic diseases, such as hepatobiliary diseases, diabetes and cardiovascular diseases, providing rapid and complementary methods for the screening and identification of systemic diseases”. KIDS achieved high AUC scores and was able to identify the five most common pathological types of CKD.
Retrospective datasets were obtained from CKD patients who had had renal biopsies. External validation datasets were obtained from multiple Chinese and Somali centres, increasing generalisability. Prospective datasets were obtained from new participants for real-world testing. The results obtained from these datasets and their validation were benchmarked against nephrologists.
The model was developed based on retinal images, which were assigned randomly to training, validation and test sets. To further evaluate the performance of the DL model when applied to populations with different prevalences of CKD, tests were conducted based on the internal test and external test datasets, with simulated prevalences. To identify the presence of the five categories of pathological diagnosis, the noninvasive model was trained, consisting of three submodels to perform five separate binary classification tasks: a retinal image model, a clinical data model and a hybrid model. For the hybrid model, a multimodal model was generated by integrating retinal images and clinical data as inputs. Patients were categorised into three groups: low-risk (risk score < Q1), medium-risk (Q1–Q3) and high-risk (risk score > Q3) according to a previous study.
To assess the value of the research, the results were compared to those of nephrologists. It outperformed nephrologists by 26.98% in accuracy, highlighting the potential of AI-driven models.
An AUC of 0.839–0.993 for CKD screening was obtained. KIDS accurately identified the five most common pathological types of CKD with an AUC of 0.790–0.932 in a multicentre and multi-ethnic validation. The AUCs are reported along with 95% DeLong confidence intervals (CIs).
An important limitation of this study is the generalisability of its results since only two ethnicities were represented when obtaining data. Still, the high AUC values calculated demonstrate the potential of this new non-invasive CKD screening tool. The generation of this tool could be transformative for less-developed regions due to the scarcity of nephrologists, asshowcased by a 2018 study, which found that while the “global nephrologist density was 8.83 per million population (PMP); high-income countries reported a nephrologist density of 28.52 PMP compared with 0.31 PMP in low-income countries” (43).
MULTIMODAL AI FOR EARLY DETECTION OF CHRONIC KIDNEY DISEASE
CKD is typically diagnosed using blood and urine tests that measure creatinine and protein levels (44). While effective, these methods are invasive, costly and require both laboratory access and patient compliance (44). To address these limitations, a recent study evaluated the use of non-invasive retinal imaging and urine dipstick testing integrated into DL models (32).
Three models were developed: eGFR-RIDL (retinal image only), eGFR-UDLR (urine only) and eGFR-MMDL (multimodal) (32). These were trained on data from 65,082 adults and externally validated in 58,284 participants, all of Korean descent (32). The multimodal approach demonstrated superior performance, achieving AUCs of 0.94 (as opposed to 0.90 in the test set) and 0.88 (as opposed to 0.77 in the external validation set), compared with the retinal-only model (32). Additionally, subgroup analysis revealed that eGFR-MMDL consistently improved predictions across all groups, particularly in individuals younger than 65 years or without proteinuria – populations often underdiagnosed by standard screening (32).
The multimodal model, therefore, offers greater accuracy, addresses underdiagnosis in younger and non-proteinuric individuals, and reduces reliance on invasive blood tests. However, there are limitations that need addressing: the study’s retrospective design, reliance on a solely Korean cohort and the model’s reduced benefit in older adults where CKD prevalence is highest (32). While promising, prospective validation in more diverse populations is required to confirm its utility (32).
NON-INVASIVE RETINAL AI FOR EARLY CKD RISK STRATIFICATION
While multimodal models have the potential to enhance CKD detection, individuals with preserved kidney function may still be overlooked. To address this, a study developed and validated the Reti-CKD score – a non-invasive risk stratification tool using deep learning (DL) on retinal photographs (38).
The model was trained on 158,216 retinal images from 79,108 South Korean adults and combined with basic clinical factors (age, sex, hypertension and diabetes) through a Cox proportional hazards model (38, 45). External validation was performed in the UK Biobank (30,477 participants) and the Korean Diabetic Cohort (5,014 participants), all with preserved kidney function (38).
The Reti-CKD score successfully stratified CKD risk, outperforming eGFR-based models with concordance index improvements of 0.020 in the UK Biobank and 0.024 in the Korean cohort (38, 46). This demonstrates its ability to stratify risk with greater accuracy, particularly in individuals with normal baseline kidney function (38).
Despite its promise as a non-invasive, accessible tool, there are significant limitations that require consideration: its reliance on UK and Korean cohorts (which restricts generalisability) and its reduced predictive power in diabetic patients, likely due to pre-existing retinal abnormalities from diabetic retinopathy (38). Further validation across diverse populations is needed to confirm its broader clinical utility (38).
III. Neurodegenerative Disease Screening with Oculomics
Neurodegenerative diseases, such as Alzheimer’s disease, Parkinson’s disease (PD) and Huntington’s Disease (HD), are chronic conditions that are responsible for damaging and destroying parts of the nervous system, especially the brain, over a period of time. There is no cure, meaning these conditions are permanent (56).
AD occurs when a buildup of extracellular deposits of beta amyloid plaques and intracellular hyperphosphorylated tau protein form in the brain, causing the cells to atrophy and lose their connections with each other; PD occurs when there is a loss of nerve cells in the substantia nigra, leading to a reduction of dopamine in the brain which is vital for regulating the movements of the body; HD is caused by a difference in one gene that a parent can pass to their child and is characterised by nerve cells in the brain starting to break down and die (57, 58, 59, 60, 61, 62).
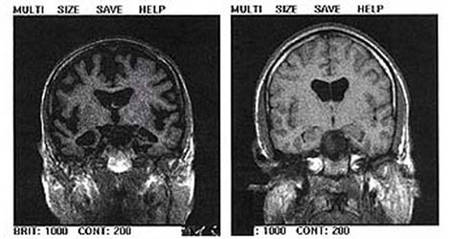
Figure 1: MRI brain scan of a person with Alzheimer’s disease on the left and a healthy brain on the right (Futura Science).
OPTICAL COHERENCE TOMOGRAPHY ANGIOGRAPHY AND THE RETINA
The fundamental concept of oculomics is that the retina serves as a “window to the brain (47)”. “Recent studies demonstrate that retinal fundus images display pathological features associated with the early stage of neurodegenerative diseases. For example, the thickness of the retinal nerve fibre layer.” (48) This is because the retina and the brain share similar physiological characteristics, embryological origin, precise neuron cell layers and microvasculature (49). Therefore, the neuronal integrity and microvasculature of the retina reflect that of the brain. Additionally, a study noted that in pre-symptomatic transgenic Alzheimer’s disease (AD) mice, amyloid-beta plaques were observed in the retina before they appeared in the brain during the pre-symptomatic stage. Specifically, these plaques emerged in the retina 2.5 months earlier than in the brain (48). These findings demonstrate that the retina could serve as an early biomarker of AD pathology before brain involvement. This means that the development of retina imaging tests would be an effective, affordable, fast and non-invasive test compared to the current AD tests. Current tests include MRI, CT and PET brain imaging, which have “high costs, low spatial resolution, and long acquisition time [which] limit their broad clinical utilisation (50)”.
In order to scan the retina, OCTA imaging has been highlighted as a fast, high-resolution, non-invasive and affordable scanning method. Biomarkers from retinal OCTA images can provide useful information for clinical decision-making to diagnose AD and mild cognitive impairment (MCI), providing a standard tool for future clinical service and research. For Xie et al.’s study (49), researchers used OCTA to scan a group of AD, MCI and healthy controls. They found that in the AD group, there was a decrease in vessel area and length densities in the inner vascular complexes and a lower number of vascular bifurcations. In the MCI group, they had a decrease in vascular area, length densities and vascular fractal dimension, as well as a lower number of bifurcations in both the superficial and inner vascular complexes compared with controls. Additionally, they discovered a larger vascular tortuosity in the inner layer of blood vessels in the retina and a larger roundness of the foveal avascular zone (FAZ) (the capillary-free area in the central macula (51)) in the SVC (the blood vessel layer on the surface of the retina).
Other scanning methods include OCT and colour fundus photography (CFP). OCT imaging has highlighted changes in macular volume, ganglion cell-inner plexiform layer (GC-IPL) thickness, retinal nerve fibre layer (RNFL) thickness and subfoveal choroidal thickness (53). There are several reasons why OCTA is effective in detecting neurodegenerative diseases compared to other methods. OCT captures structural changes in the retinal layers, while OCTA can detect abnormalities in blood flow and vascular networks, making it more likely to identify early alterations associated with AD or MCI. Although CFP is widely used, it has “limited image resolution (60–300 μm in diameter) (54)” and cannot reliably detect subtle vascular changes, which makes it difficult to capture the earliest stages of neurodegeneration. Recent studies have shown that microvascular density and FAZ changes detected by OCTA serve as biomarkers for AD and MCI (49, 53). Therefore, OCTA is a promising tool for the early detection of neurodegenerative diseases.
WHY AI IN OCULOMICS TO DETECT NEURODEGENERATIVE DISEASES?
The reason AI is used in oculomics is that the retinal changes linked to neurodegenerative diseases are subtle, complex and often invisible to the human eye. Tian et al.’s study proved that “trained machines give higher attention to small vessel areas [and] can comprehend data at multiple levels, including pixel level, which humans cannot achieve (48)”. AI, especially deep learning, can detect new patterns, quantify features and combine multimodal data in ways humans cannot. Therefore, AI can make retinal imaging a powerful tool for early detection of neurodegenerative diseases. The current AI deep learning algorithm introduced by researchers includes Eye-AD (54) and CNNs (53).
Eye-AD uses a multilevel graph representation that “explores intra- and inter-instance relationships across diverse retinal and choroidal layers, leveraging the unique capabilities of OCTA data (54)”. “Eye-AD has demonstrated decision-making patterns consistent with prior clinical findings.” (54) The reliability/AUC of the correct diagnosis of AD and MCI using Eye-AD is high (internal data: AUC = 0.9355, external data: AUC = 0.9007) and MCI detection (internal data: AUC = 0.8630, external data: AUC = 0.8037) (54).
CNNs “predict AD diagnosis using [] multimodal retinal images, which include GC-IPL thickness maps, SCP OCTA images and ultra-widefield (UWF) colour and fundus autofluorescence (FAF) scans (53)”. Therefore, combining the input information to CNN with the multimodal retinal imaging, the accuracy of detecting AD with CNN will improve.
Wisely et al. investigated the different combinations of multimodal information to determine the best-performing model. AUC values for predicted probability of AD from retinal images varied by input: UWF colour = 0.450, OCTA SCP = 0.582, UWF FAF = 0.618, GC-IPL maps = 0.809 (53). These values indicate the accuracy with which the CNN model can correctly classify AD and healthy control subjects. This result suggests that GC-IPL maps are the most useful single inputs for prediction. Various combinations of input information were tried, and “the best-performing model, including GC-IPL maps, quantitative data and patient data, achieved an AUC of 0.861 (95% CI 0.727, 0.995) on the validation set and 0.841 (95% CI 0.739, 0.943) on the test set (53)”.
One limitation of AI detection of neurodegenerative disease using OCTA images is the unstable results due to the difference in OCTA image quality. To ensure consistent results across photos of testing machines from different hospitals, the model could adopt “DSBN, which can correct for variations in appearance, and UDA, which creates a common feature space (55)”. The second limitation is the limited size of the dataset provided to the AI model during the training process. At present, the dataset is limited by the available data in a certain country, the image quality and the specific conditions of the participants, though this may improve through further research in the future. The limitation of dataset size will increase the risk of overfitting. The countermeasures could be adding external quantitative data (OCTA SCP, GC-IPL thickness map), L1/L2 regularisation, data augmentation and transfer learning (53). The third limitation is the possible bias during the training process of AI models. The AI model will get biased information during the training process, including factors such as race, gender and age. For example, the “dataset lacked diversity in ethnic groups (54)” in a study of AI usage in oculomics. This will also lead to a limitation of generalisability in the AI screening tool. Therefore, future work should provide a large dataset to the AI model during the training process, evaluate the model’s generalisability across diverse populations and settings, test it on retinal images from different cameras and investigate the interpretability of the deep learning algorithms as well as their clinical implementation (55).
TYPES OF SCANS TO DIAGNOSE NEURODEGENERATIVE DISEASE
- OCT scans use micrometre light to capture high-resolution, cross-sectional images of the retina, optic nerve and other structures.
- OCTA takes consecutive OCT scans and reconstructs them into a structural image that allows clinicians to further assess the retinal microvasculature and choroid.
- SLO (scanning laser ophthalmoscopy) generates finely formed images utilising laser illumination in combination with confocal optical structures.
- FLIO (fluorescence lifetime imaging ophthalmoscopy) utilises fluorescence lifetime measurements of excited fluorophores to detect retinal changes.
- ERG (electroretinography) can evaluate retinal health by measuring the electrical activity of the retina in response to light through small electrodes placed on the cornea of the eye.
- VEPs (visual-evoked potentials) measure the electrical activity of the visual pathways in the brain through electrodes placed on the scalp (58).
For Alzheimer’s disease, one of the simplest methods of examining the retina is with ocular fundus imaging, which is a photograph of the rear of the eye. Studies involving fundus imaging have demonstrated ocular pathology in patients with AD, like maculopathy, optic neuropathy and diffuse wedge shape-nerve fibre layer drop-out. However, these are not limited to AD, making it less effective as a diagnostic tool. SLO has been reported to detect optic nerve hypoplasia and an increased cup-to-disc ratio in AD patients; however, other studies have failed to demonstrate significant differences in optic nerve head structure between AD patients and healthy controls. Consequently additional research is necessary. Another solution would be to use SLO with lipid curcumin fluorescence, which would allow for measuring retinal amyloid deposit weight, a key biomarker for AD. A promising screening method would be to include fluorescence lifetime imaging ophthalmoscopy, FLIO, which can detect changes indicative of AD by measuring the fluorescence decay parameters of endogenous fluorophores of the retina. Early signs of AD include the thinning of the retina. The most widely used technique for measuring this is OCT, and most studies found a link between retinal thinning and AD. However, retinal thinning also happens with ageing and is not specific to AD. OCTA studies have shown that narrowing of retinal veins and reduced blood flow may be potential parameters for detection. However, other studies have found no links with AD and retinal vascular measurements. This can be linked to the novelty of oculomics and demonstrates a need for more research.
For Parkinson’s disease, ocular biomarkers are currently being investigated for changes in visual acuity, contrast sensitivity, colour vision, pupil diameter and eye movement. Many studies using OCT have demonstrated a link between PD and retinal nuclear layer thinning, decreased macular retinal thickness, and reduced macular volume and RNLF. An SLO study found similar reduction in RNLF thickness but also identified an increase in the nerve fibre index. However, there were inconsistencies in some structural measures, possibly due to differences in patient’s disease, stage, hardware or analysis technique. The combination of OCT with other retinal functional measures such as ERG may show better results in detecting PD. Other potential biomarkers to predict quality of life and disease severity are pattern ERG (pERG ), by detecting decreased amplitudes, and multifocal ERG (mERG), which can detect reduced activity in the macular and paramacular zones when compared to match controls. However, one study was not able to confirm a difference in VEP amplitude and latency values between PD patients and control groups. Therefore more research is needed. A detection of retinal microvascular damage through OCTA has provided strong predictive value for monitoring the severity of PD.
As for Huntington’s disease, fundus imaging is not very useful. Retinal parameters in HD demonstrate less potential for early diagnosis and monitoring, principally due to differences in manifest. Most HD patients have a thinning of the macula and RNLF, with the largest regression coefficients being the INL. Similarly, a correlation between decreased macular volume and temporal RNLF has been observed, indicating potential for OCT biomarkers. However, there are no significant associations between clinical outcome and the OCT-derived parameters for premanifest patients. Other studies have demonstrated that OCT retinal parameters may not be sensitive enough to detect early changes in HD patients. Choroidal measurements have demonstrated more consistency as a biomarker for HD; there is a significant reduction in the macular region and central choroidal thickness, reflecting vesicular involvement in HD, but the parameters are not well defined. ERG has demonstrated some potential for early detection in a case study and multiple mouse models. Retinal dysfunction and degeneration have been similarly observed in mouse models but the human research has been gravely limited. On the mouse models, the ERG recording indicated severely reduced cone and rod response and other electrophysiological abnormalities, indicating the potential diagnostic value for detecting neuronal pathology in HD. However, further studies with a larger sample size are necessary to confirm electrophysiology as a potential biomarker for quantifying the disease progression (58).
Conclusion
While significant steps towards improving and implementing oculomics into the clinical workplace have taken place over the last few years, oculomics still has very few in practice models. Next steps have to be taken into consideration in order for there to be a promising future for oculomics and for advancements to continue. Advancements in AI and eye scan technology are not the only things to be considered when discussing next steps, but also ethical considerations and strategies for how to successfully integrate oculomics into a clinical space that can be used outside of ocular health. As our population ages, an increasing amount of people are affected by systemic disease. Due to this, a more non-invasive efficient method of preventing and diagnosing systemic disease is essential in healthcare. The future of oculomics has potential for being a solution for this issue as it shows extreme promise and has potential for becoming one of the most powerful tools for diagnosing systemic disease in a non-invasive efficient way.
Bibliography
- Wagner, S.K., Fu, D.J., Faes, L. et al. (2020) ‘Insights into systemic disease through retinal imaging-based oculomics’, Translational Vision Science & Technology, 9(2), pp. 6.
- Zhu, Z., Wang, Y., Qi, Z. et al. (2025) ‘Oculomics: Current concepts and evidence’, Progress in Retinal and Eye Research, 106, 101350. <https://doi.org/10.1016/j.preteyeres.2025.101350>
- Honavar, S. (2022) ‘Oculomics – The eyes talk a great deal’, Indian J Ophthalmol, 70(3):713. <https://doi.org/10.4103/ijo.IJO_474_22>
- Syed, M.G., Trucco, E., Mookiah, M.R.K. et al. (2025) ‘Deep-learning prediction of cardiovascular outcomes from routine retinal images in individuals with type 2 diabetes’, Cardiovasc Diabetol, 24(3). <https://doi.org/10.1186/s12933-024-02564-w>
- Cheung, C.Y., Xu, D., Cheng, C.Y. et al. (2022) ‘Deep learning in detecting Alzheimer’s disease from retinal images’, Alzheimer’s & Dementia, 18(1), pp. 108–118.
- Wong, T.Y. & Bressler, N.M. (2016) ‘Artificial intelligence with deep learning technology looks into diabetic retinopathy screening’, JAMA, 316(22), pp. 2366–2367.
- Ting, D.S.W., Cheung, C.Y., Lim, G. et al. (2019) ‘Development and validation of a deep learning system for diabetic retinopathy and related eye diseases using retinal images from multiethnic populations with diabetes’, JAMA, 318(22), pp. 2211–2223.
- Gunn, R.M. (1892) ‘Ophthalmoscopic evidence of general arterial disease’, Transactions of the Ophthalmological Society of the United Kingdom, 12, pp. 227–245.
- Attebo, K., Mitchell, P. & Smith, W. (1996) ‘Visual acuity and the causes of visual loss in Australia’, Ophthalmology, 103(3), pp. 357–364.
- Ikram, M.K., de Jong, F.J., Vingerling, J.R. et al. (2006) ‘Retinal vessel diameters and risk of hypertension: the Rotterdam Study’, Hypertension, 47(2), pp. 189–194.
- Wong, T.Y., Klein, R., Klein, B.E.K. et al. (2001) ‘Retinal microvascular abnormalities and their relationship with hypertension, cardiovascular disease, and mortality’, Survey of Ophthalmology, 46(1), pp. 59–80.
- Cheung, C.Y., Hsu, W., Lee, M.L. et al. (2010) ‘A new method to measure retinal vascular tortuosity’, Investigative Ophthalmology & Visual Science, 51(1), pp. 535–541.
- Lau, Q.P., Cheung, C.Y., Cheng, C.Y. et al. (2014) ‘Novel retinal vessel tortuosity measurement in predicting diabetic retinopathy’, Diabetes Care, 37(9), pp. 2447–2454.
- Zhou, Y., He, M., Keane, P.A. et al. (2023) ‘Foundation models for generalisable oculomics’, Nature Medicine, 29(11), pp. 1872–1882.
- Collins, R. (2012) ‘UK Biobank: an open access resource for identifying the causes of a wide range of complex diseases of middle and old age’, PLoS Medicine, 9(3), e100118.
- Zhou, Y., He, M., Keane, P.A., et al. (2023) ‘Foundation models for generalisable oculomics’, Nature Medicine, 29(11):1872–1882.
- Li, Z., Yin, S., Wang, S., Wang, Y., Qiang, W. & Jiang, J. (2024) ‘Transformative applications of oculomics-based AI approaches in the management of systemic diseases: A systematic review’, J Adv Res, [Epub ahead of print]. <https://doi.org/10.1016/j.jare.2024.11.018>
- British Heart Foundation (2025) Global Heart & Circulatory Diseases Factsheet [Internet]. <https://www.bhf.org.uk/-/media/files/for-professionals/research/heart-statistics/bhf-cvd-statistics-global-factsheet.pdf>
- World Health Organization (n.d.) Cardiovascular Diseases [Internet]. <https://www.who.int/health-topics/cardiovascular-diseases#tab=tab_1>
- Ghenciu, L.A., Dima, M., Stoicescu, E.R., Iacob, R., Boru, C. & Hațegan, O.A. (2024) ‘Retinal Imaging-Based Oculomics: Artificial Intelligence as a Tool in the Diagnosis of Cardiovascular and Metabolic Diseases’, Biomedicines, 12(9):2150.
- Janiesch, C., Zschech, P. & Heinrich, K. (2021) ‘Machine learning and deep learning’, Electron Markets, 31:685–95.
- Ma, Y., Xiong, J., Zhu, Y., Ge, Z., Hua, R., Fu, M., Li, C., Wang, B., Dong, L., Zhao, X., Chen, J., Rong, C., He, C., Chen, Y., Wang, Z., Wei, W., Xie, W. & Wu, Y. (2022) ‘Deep learning algorithm using fundus photographs for 10-year risk assessment of ischemic cardiovascular diseases in China’, Sci Bull (Beijing), 67(1):17-20. <https://doi.org/10.1016/j.scib.2021.08.016>
- Yi, J.K., Rim, T.H., Park, S., Kim, S.S., Kim, H.C., Lee, C.J., Kim, H., Lee, G., Lim, J.S.G., Tan, Y.Y., Yu, M., Tham, Y.C., Bakhai, A., Shantsila, E., Leeson, P., Lip, G.Y.H., Chin, C.W.L. & Cheng, C.Y. (2023) ‘Cardiovascular disease risk assessment using a deep-learning-based retinal biomarker: a comparison with existing risk scores’, Eur Heart J Digit Health, 4(3):236-244.
- Rim, T.H., Lee, C.J., Tham, Y.C., Cheung, N., Yu, M., Lee, G., Kim, Y., Ting, D.S.W., Chong, C.C.Y., Choi, Y.S., Yoo, T.K., Ryu, I.H., Baik, S.J., Kim, Y.A., Kim, S.K., Lee, S.H., Lee, B.K., Kang, S.M., Wong, E.Y.M., Kim, H.C., Kim, S.S., Park, S., Cheng, C.Y. & Wong, T.Y (2021) ‘Deep-learning-based cardiovascular risk stratification using coronary artery calcium scores predicted from retinal photographs’, Lancet Digit Health, 3(5):e306-e316.
- Tseng, R.M.W.W., Rim, T.H., Shantsila, E., Yi, J.K., Park, S., Kim, S.S., Lee, C.J., Thakur, S., Nusinovici, S., Peng, Q., Kim, H., Lee, G., Yu, M., Tham, Y.C., Bakhai, A., Leeson, P., Lip, G.Y.H., Wong, T.Y. & Cheng, C.Y. (2023) ‘Validation of a deep-learning-based retinal biomarker (Reti-CVD) in the prediction of cardiovascular disease: data from UK Biobank’, BMC Med, 21(1):28. <https://doi.org/10.1186/s12916-022-02684-8>
- Lee, Y.C., Cha, J., Shim, I., Park, W.Y., Kang, S.W., Lim, D.H. & Won, H.H. (2023) ‘Multimodal deep learning of fundus abnormalities and traditional risk factors for cardiovascular risk prediction’, Npj Digit Med, 6:14.
- Li, L.Y., Isaksen, A.A., Lebiecka-Johansen, B., Funck, K., Thambawita, V., Byberg, S., Andersen, T.H., Norgaard, O. & Hulman, A. (2024) ‘Prediction of cardiovascular markers and diseases using retinal fundus images and deep learning: a systematic scoping review’, Eur Heart J Digit Health, 5(6):660-669. <https://doi.org/10.1093/ehjdh/ztae068>
- Hu, W., Yii, F.S.L., Chen, R., Zhang, X., Shang, X., Kiburg, K., Woods, E., Vingrys, A., Zhang, L., Zhu, Z. & He, M. (2023) ‘A Systematic Review and Meta-Analysis of Applying Deep Learning in the Prediction of the Risk of Cardiovascular Diseases From Retinal Images’, Transl Vis Sci Technol, 12(7):14. <https://doi.org/10.1167/tvst.12.7.14>
- Poplin, R., Varadarajan, A.V., Blumer, K., Liu, Y., McConnell, M.V., Corrado, G.S., Lily, P. & Dale, W. (2018) ‘Prediction of cardiovascular risk factors from retinal fundus photographs via deep learning’, Nat Biomed Eng, 2:e526-e536.
- KDIGO (2013) ‘Chapter 1: Definition and classification of CKD’, Kidney International Supplements, 3(1):19–62.
- Wu, Q., Li, J., Zhao, L., Liu, D., Wen, J., Wang, Y. et al. (2025) ‘A noninvasive model for chronic kidney disease screening and common pathological type identification from retinal images’, Nature Communications, 16(1).
- Bhak, Y., Lee, Y.H., Kim, J., Lee, K., Lee, D., Jang, E.C., et al. (2025) ‘Diagnosis of Chronic Kidney Disease Using Retinal Imaging and Urine Dipstick Data: Multimodal Deep Learning Approach’, JMIR Medical Informatics, 13:e55825–5.
- Matovinović, M.S. (2009) ‘1. Pathophysiology and Classification of Kidney Diseases’, EJIFCC, 20(1):2.<https://pmc.ncbi.nlm.nih.gov/articles/PMC4975264/>
- Geetha, R. & Amaresan, M. (2008) ‘Early Diagnosis of CkD and Its Prevention SCREENING FOR EARLY EVIDENCE OF CHRONIC kIDNEY DISEASE (CkD)’ [Internet]. <https://citeseerx.ist.psu.edu/document?repid=rep1&type=pdf&doi=21fd6058cd6ad7c12f6536c4e9fdf5dcf819bf47>
- Inker, L.A. & Levey, A.S. (2019) ‘Knowing your GFR—when is the number not (exactly) the number?’, Kidney International, 96(2):280–2.
- National Kidney Foundation (2022) ‘Estimated Glomerular Filtration Rate (eGFR)’, National Kidney Foundation [Internet]. <https://www.kidney.org/kidney-topics/estimated-glomerular-filtration-rate-egfr>
- Hull, K.L., Adenwalla, S.F., Topham, P. & Graham-Brown, M.P. (2022) ‘Indications and considerations for kidney biopsy: an overview of clinical considerations for the non-specialist’. Clinical Medicine, 22(1):34–40. <https://www.ncbi.nlm.nih.gov/pmc/articles/PMC8813013/>
- Joo, Y.S., Rim, T.H., Koh, H.B., Yi, J., Kim, H., Lee, G. et al. (2023) ‘Non-invasive chronic kidney disease risk stratification tool derived from retina-based deep learning and clinical factors’, npj digital medicine, 6(1). <https://www.ncbi.nlm.nih.gov/pmc/articles/PMC10276847>
- Zoncapè, M., Liguori, A., Tsochatzis, E.A. (2024) ‘Non-invasive testing and risk-stratification in patients with MASLD’, European journal of internal medicine, 122:11–9.
- Rawat, A.S., Rajendran, J., Sikarwar, S.S. (2025) ‘Introduction to AI in Disease Detection — An Overview of the Use of AI in Detecting Diseases, Including the Benefits and Limitations of the Technology’, AI in Disease Detection, 1–26.
- Bobbit, Z. (2021) ‘What is Considered a Good AUC Score?’, Statology [Internet]. <https://www.statology.org/what-is-a-good-auc-score/>
- Statistics.com (2018) ‘Prospective vs. Retrospective’, Statistics.com: Data Science, Analytics & Statistics Courses [Internet]. <https://www.statistics.com/prospective-vs-retrospective/>
- Osman, M.A., Alrukhaimi, M., Ashuntantang, G.E., Bellorin-Font, E., Gharbi, M.B., Braam. B. et al. (2018) ‘Global nephrology workforce: gaps and opportunities toward a sustainable kidney care system’, Kidney International Supplements, 8(2):52–63.
- Han, S., Yamamoto, S., Jung, C.Y., Jin, D.Y., Lee, T. & Kim, J.S. (2024) ‘Wearable sensors for monitoring chronic kidney disease’, Communications Materials, 5(1). <https://www.nature.com/articles/s43246-024-00606-0#citeas>
- Wilson, M. (2018) ‘Survival Analysis II Cox Proportional Hazards Models’ [Internet Seminar]. <https://health.ucdavis.edu/media-resources/ctsc/documents/pdfs/cph-model-presentation.pdf>
- Longato, E., Vettoretti, M. & Di Camillo, B. (2020) ‘A practical perspective on the concordance index for the evaluation and selection of prognostic time-to-event models’, Journal of Biomedical Informatics, 108:103496. <https://www.sciencedirect.com/science/article/pii/S1532046420301246>
- Ptito, M., Bleau, M. & Bouskila, J. (2021) ‘The retina: a window into the brain’, Cells, 10(12):3269. <https://doi.org/10.3390/cells10123269>
- Tian, J., Smith, G., Guo, H., Liu, B., Pan, Z., Wang, Z. et al. (2021) ‘Modular machine learning for Alzheimer’s disease classification from retinal vasculature’, Sci Rep, 11(1):238. <https://doi.org/10.1038/s41598-020-80312-2>
- Xie, J., Yi, Q., Wu, Y., Liu, Y., Zheng, Y., Fu, H. et al. ‘Deep segmentation of OCTA for evaluation and association of changes of retinal microvasculature with Alzheimer’s disease and mild cognitive impairment’, Br J Ophthalmol, 108(3):432–439. <https://doi.org/10.1136/bjophthalmol-2022-321399>
- Liu, K., Li, J., Raghunathan, R., Zhao, H., Li, X. & Wong, S.T.C. (2021) ‘The Progress of Label-Free Optical Imaging in Alzheimer’s Disease Screening and Diagnosis’, Front Aging Neurosci, 13:699024. <https://doi.org/10.3389/fnagi.2021.699024>
- Ishii, H., Shoji, T., Yoshikawa, Y., Kanno, J., Ibuki, H. & Shinoda, K. (2019) ‘Automated measurement of the foveal avascular zone in swept-source optical coherence tomography angiography images’, Trans Vis Sci Tech, 8(3):28. <https://doi.org/10.1167/tvst.8.3.28>
- ScienceDirect (n.d.) ‘Retinal nerve fibre layer’, ScienceDirect Topics [Internet] (Elsevier).
- Wisely, C.E., Wang, D., Henao, R., Grewal, D.S., Thompson, A.C., Robbins, C.B. et al. (2022) ‘Convolutional neural network to identify symptomatic Alzheimer’s disease using multimodal retinal imaging’, Br J Ophthalmol, 106(3):388–395. <https://doi.org/10.1136/bjophthalmol-2020-317659>
- Hao, J., Kwapong, W.R., Shen, T., Fu, H., Xu, Y., Lu, Q. et al. (2024) ‘Early detection of dementia through retinal imaging and trustworthy AI’, npj Digital Medicine, 7(1):294. <https://doi.org/10.1038/s41746-024-01292-5>
- Cheung, C.Y., Ran, A.R., Wang, S., Chan, V.T.T., Sham, K., Hilal, S. et al. (2022) ‘A deep learning model for detection of Alzheimer’s disease based on retinal photographs: a retrospective, multicentre case-control study’, Lancet Digit Health, 4(11):e806–e815. <https://doi.org/10.1016/S2589-7500(22)00169-8>
- Cleveland Clinic (2023) ‘Neurodegenerative Diseases’, Cleveland Clinic [Internet]. <https://my.clevelandclinic.org/health/diseases/24976-neurodegenerative-diseases>
- Fondation Vaincre Alzheimer (n.d.) ‘Alzheimer en Quelques Chiffres’, Fondation Vaincre Alzheimer [Internet]. <https://www.vaincrealzheimer.org/la-maladie/quelques-chiffres/>
- Suh, A., Ong, J., Kamran, S.A., Waisberg, E., Paladugu, P., Zaman, N., Sarker, P., Tavakkoli, A. & Lee, A.G. (2023) ‘Retina Oculomics in Neurodegenerative Diseases’, Ann Biomed Eng, 51:2708–2721.
- NHS (2022) ‘Parkinson’s Disease’, NHS [Internet]. <https://www.nhs.uk/conditions/parkinsons-disease/>
- Mayo Clinic (2024) ‘Parkinson’s disease’, Mayo Clinic [Internet]. <https://www.mayoclinic.org/diseases-conditions/parkinsons-disease/symptoms-causes/syc-20376055>
- Mayo Clinic (2024) ‘Huntington’s Disease’, Mayo Clinic [Internet]. <https://www.mayoclinic.org/diseases-conditions/huntingtons-disease/symptoms-causes/syc-20356117>
- National Institute of Neurological Disorders and Stroke (2025) ‘Huntington’s Disease’, NIH [Internet]. <https://www.ninds.nih.gov/health-information/disorders/huntingtons-disease>

