
Abstract
The prisoner’s dilemma has been analysed as a case example in analysing conditions and evolution of cooperation in situations where the Nash equilibrium is suboptimal relative to mutual cooperation (Axelrod & Hamilton, 1981). This paper reviews the extensive literature on modelling the evolution of strategies in the Iterated Prisoner’s Dilemma (IPD), identifying traits of successful strategies. The Tit-for-Tat strategy has traditionally performed well, but is not an evolutionary stable strategy (ESS) due to its vulnerability to drift by unconditional cooperators. This paper tests a ‘Deceptive Tit-for-Tat’ strategy that identifies and exploits unconditional cooperators. In colloquial jargon, the strategy performs a ‘shit test’ to penalise the most generous strategies. The test consisted of several simulations of evolutionary tournaments. Deceptive Tit-for-Tat performed well at first, but once unconditional cooperators diminished in the simulated probabilities, tit for tat outperformed deceptive tit for tat due to a greater capacity for cooperation. This result suggests that ‘shit test’ strategies are more envious than optimal when interacting with tit for tat mutual cooperators. Possible real-world applications are discussed.
Introduction
Game theory is a mathematical representation of the decision-making process. This study examines the Iterated Prisoner’s Dilemma (IPD). This scenario shows us that individual self-interest does not always produce the best possible outcomes when the Nash equilibrium is not Pareto optimal. In the classical formulation of the Prisoner’s Dilemma, two suspects are arrested and interrogated separately. They are both offered a deal: if one confesses and the other one stays silent the defector goes free, and the silent partner gets a greater sentence. If both confess, they both receive a moderate sentence. If both stay silent, they receive a light sentence.
The Iterated Prisoner’s Dilemma is a scenario where two agents repeatedly choose to cooperate or to defect. The outcome of each game is summed up, and the player with the most points (or least number of years in prison) wins. Based on the payoff matrix, the individual response in the one shot game is to defect – yet both would prefer to agree to both cooperate; i.e., this would be a Pareto improvement. Therefore, the question of whether cooperation can be sustained in an evolutionary setting is of large real-world interest.
Background
Robert Axelrod is an American political scientist and professor at the University of Michigan best known for his pioneering work on cooperation through game theory. In the 1970s and 80s, at the height of the Cold War, he was interested in how countries or individuals could achieve cooperation without a central authority. He organised the Axelrod computer tournament in 1980 (with an extended version in 1981), in which famous scholars, mathematicians and computer scientists submitted various strategies to play in a repeated version (iterated) prisoner’s dilemma. These strategies were an amalgamation of cooperation and defection, and all these different strategies played against each other in a round robin tournament format. The most successful strategy was the Tit-for-Tat (TFT) strategy, submitted by Anatol Rapoport, wherein the strategy starts with cooperation, then mirrors the opponent’s previous move. The results of this game, which were later published in the 1984 book The Evolution of Cooperation, illustrated telling results from different strategies.
The implications are far reaching and the tournament’s lessons can be applied to international relations (explaining how nuclear rivals might avoid escalations), economics (where companies decide whether to cooperate or compete), parts of computer science and even evolutionary biology. Axelrod’s insights are highly valuable and relevant and inform cybersecurity, climate change negotiations and the development of artificial intelligence (AI) systems. This tournament shapes how people understand the foundations of cooperation between human and technological societies. The tournament is described at length below, including results reported in later literature.
Axelrod’s Tournament
SETUP OF THE ITERATED PRISONER’S DILEMMA (IPD) TOURNAMENT
There is a pool of strategies (e.g., Tit-for-Tat, Always Cooperate, Always Defect, Grudger, Random etc.) depending on the library. Each strategy plays a repeated game against every other strategy (and usually against itself too). A match is usually 200 rounds long. After each round, both players get a payoff based on their joint choices (C: cooperation or D: defect).
THE PAYOFFS
Typical payoff matrix (Prisoner’s Dilemma convention):
- T (Temptation to defect) = 5
- R (Reward for mutual cooperation) = 3
- P (Punishment for mutual defection) = 1
- S (Sucker’s payoff) = 0
If both cooperate, both get 3 per round; if both defect, both get 1; if one defects while the other cooperates, the defector gets 5 and the cooperator gets 0.
SCORING
At the end of each match, you average the player’s total payoffs across the rounds to get that player’s match utility. Then, you average across all matches against all opponents, giving the mean utility for each player.
WHAT IT INDICATES
Top strategies are usually nice but retaliatory ones, like Tit-for-Tat or Win-Stay-Lose-Shift (WSLS): they cooperate with cooperators but don’t get exploited by defectors. Middle strategies are often inconsistent ones (sometimes cooperate, sometimes defect). Bottom strategies (right side) are usually selfish ones, like Always Defect: they do fine against naïve opponents but badly overall (Axelrod & Hamilton, 1981). Each individual has an incentive to act in a less optimal way than what benefits the group; however, as a result, both find themselves in a worse state than if they had cooperated. This is the basis of the Prisoner’s Dilemma, and it is applicable to the real world in many ways, especially in economics (The Investopedia Team, 2022).
There are three main types of tournament: standard tournament, noisy tournament and probabilistic tournament.
I. STANDARD TOURNAMENT
– Setup: Each pair of strategies plays a fixed number of rounds (often 200).
– Deterministic: If a strategy says “play C”, it plays C.
– End condition: Every match ends after exactly the same number of rounds.
– Usefulness: Provides a “clean” baseline for comparing strategies.
– Downside: Can favour strategies that exploit the fixed length (e.g., defecting on the last move).
II. NOISY TOURNAMENT
– Setup: Same as standard, except there is a chance of noise (error).
– Noise: With a fixed probability (e.g., 5% or 10%), a player’s intended move (C or D) gets flipped. For example, if a strategy meant to play C, it might accidentally play D.
– Purpose: Models real-world scenarios where misunderstandings or mistakes happen.
– Effect: Tests how forgiving strategies are. For example, harsh retaliators (like Grim Trigger: cooperate until the opponent defects, then defect forever) usually perform worse under noise since a single accidental D ruins cooperation forever; forgiving strategies (like Tit-for-Tat with forgiveness, or Win-Stay-Lose-Shift) tend to do better.
III. PROBABILISTIC ENDING TOURNAMENT
– Setup: Instead of a fixed number of rounds, after each round there is a probability that the game ends immediately. For example, if p = 0.01, then on average the game lasts about 100 rounds, but no one knows when it will stop.
– Purpose: Models real-life situations where interactions don’t have a clear endpoint.
– Effect: Prevents “last-round defecting” strategies. For example, in a fixed-length game, some strategies defect at the very end since there’s no punishment left; with probabilistic endings, there’s always a chance of future retaliation, so cooperation is more stable.
The Ranked Violin Plot
Violin plots show the mean utility of each player: i.e., how well a specific strategy did over the course of the tournament. Violin plots are used when you want to observe the distribution of numeric data and are especially useful when you want to make a comparison of distributions between multiple groups (Yi, n.d.).
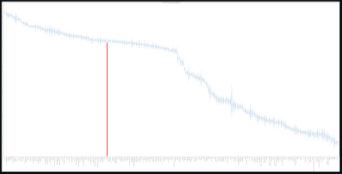
Figure 1: Ranked Violin Plot in Standard Tournament (Yi, n.d.).
The violin plot is a visual tool that shows: (1) how well a strategy performed across many tournaments; (2) its consistency (how consistent or variable its performance was); and (3) when ranked, which strategies are better or worse.
– X-axis: Each tick represents a different player (or strategy), ordered from highest to lowest mean utility. The numbers (0-2.8) show the mean number of points.
– Y-axis: Represents utility (payoff). Higher up means that player/strategy performed better on average.
– Violin shape: Each “violin” shows the distribution of that player’s payoffs across all its matches, not just the mean. The wider the violin at a given point, the more frequently that utility value occurred. The thin extensions (whiskers) show the range of outcomes.
– Ranking: Players on the left performed best (higher mean utility) and those on the right performed worst.
For example, Tit-for-Tat is one of the many strategies shown in Figure 1 (red line). Usually, it performs very well overall and gets consistently good payoffs against most strategies since it cooperates with cooperators and punishes defectors. Its violin shape tends to be narrow (low variance) because it is reliable: it doesn’t dominate everyone, but it avoids very poor results. Figure 2 and Figure 3 show the results for noisy and probabilistically ending tournaments, respectively, in the Axelrod-Python Tournament (Axelrod-Python Tournament, n.d.). The Tit-for-Tat strategy is indicated in red.
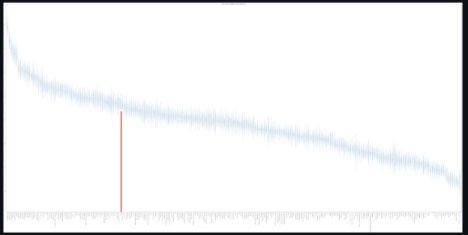
Figure 2: Ranked Violin Plot in Noisy Tournament (Axelrod-Python Tournament, 2015).

Figure 3: Ranked Violin Plot in Probabilistic Ending Tournament (Axelrod-Python Tournament, 2015).
PAYOFFS
Figures 4, 5 and 6 show the difference of payoffs between players. From the colour bar on the right of each figure:
- Purple (dark) = low utility (bad performance, close to 0).
- Green = medium utility.
- Yellow (bright) = high utility (close to max payoff, ~3).
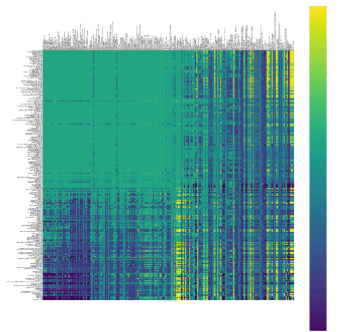
Figure 4: Payoff in Standard Tournament (Axelrod-Python Tournament, 2015).

Figure 5: Payoff in Noisy Tournament (Axelrod-Python Tournament, 2015).
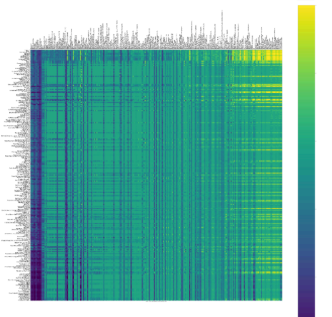
Figure 6: Payoff in Probabilistic Ending Tournament (Axelrod-Python Tournament, 2015).
INTERPRETATION
– Who cooperates successfully: If two strategies are both “nice”, their pairwise payoff cells will be bright. This means they achieve close to the maximum payoff; for example, TFT vs TFT = stable cooperation, so both do well.
– Who exploits whom: When an “exploiter” strategy (like Always Defect) meets a “naïve cooperator” (like Always Cooperate), the exploiter’s payoff cell will be bright (yellow) while the cooperator’s will be dark (purple). This asymmetry shows who is winning the one-sided exchange; for example, AD vs AC = AD averages ~5 and AC averages ~0.
– Who cancels whom out: If both players are highly selfish or retaliatory (e.g., Always Defect vs Grim Trigger), their cells will be dark purple/blue, around payoff ~1. This shows mutual punishment: neither side gains much since both defect constantly.
Some rows have only one colour, while others have many different colours; for example, Sneaky Tit-for-Tat which has yellow with cooperators and purple with retaliators. Always Defect has a constantly dark colour (Axelrod-Python Tournament, 2015).
Evolutionary Dynamics
STANDARD, NOISY & PROBABILISTIC RESPECTIVELY
Evolutionary dynamics shows whether cooperation or defection would dominate in the long run, how strategies invade and resist invasion, and whether stable patterns emerge when strategies evolve. This shows us:
- Survival of the fittest strategies: Imagine a population with many players, each using one of the strategies (TFT, Always Defect, etc.). They play repeated games against each other, get payoffs and then “reproduce” proportionally to those payoffs. Strategies with higher average payoffs increase in frequency, while those with poor payoffs decline. This mimics natural selection or cultural learning.
-
Stability of cooperation and defection: If cooperative strategies consistently do well, they become more abundant. If defectors invade and get an advantage against cooperators, evolutionary dynamics shows whether cooperation collapses or if retaliatory strategies push defectors back down.
-
Cycles/different long run behaviours: Including stable equilibrium, where one strategy dominates; mixed equilibrium, where multiple strategies coexist (e.g., TFT and WSLS balance); and cyclic dynamics, where strategies rise/fall in waves depending on strategies.
-
Effect of noise and errors: E.g., in a standard tournament, TFT often wins, but with noise, TFT can get trapped in endless retaliation. Small errors can therefore have a large impact.
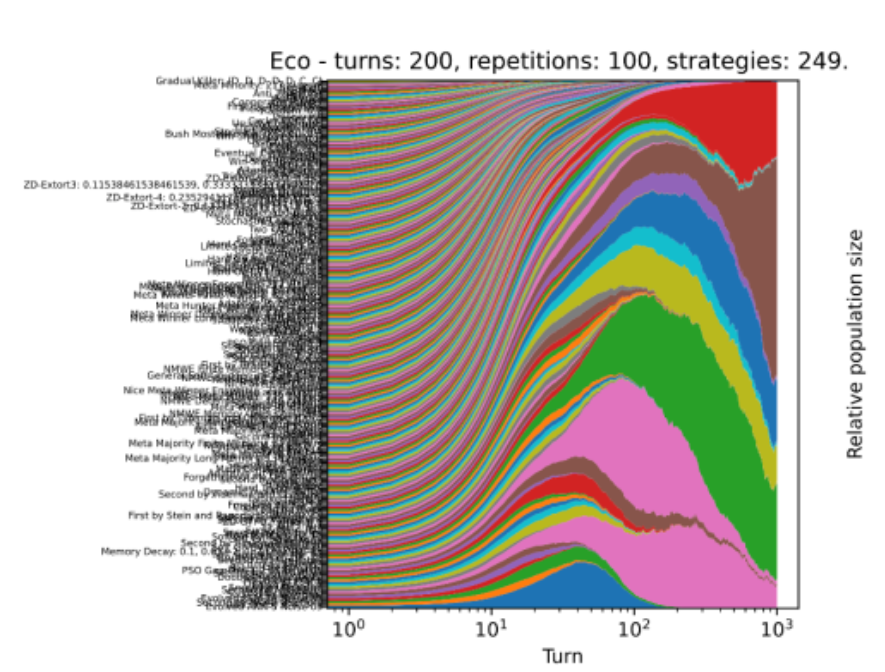
Figure 7: Standard.
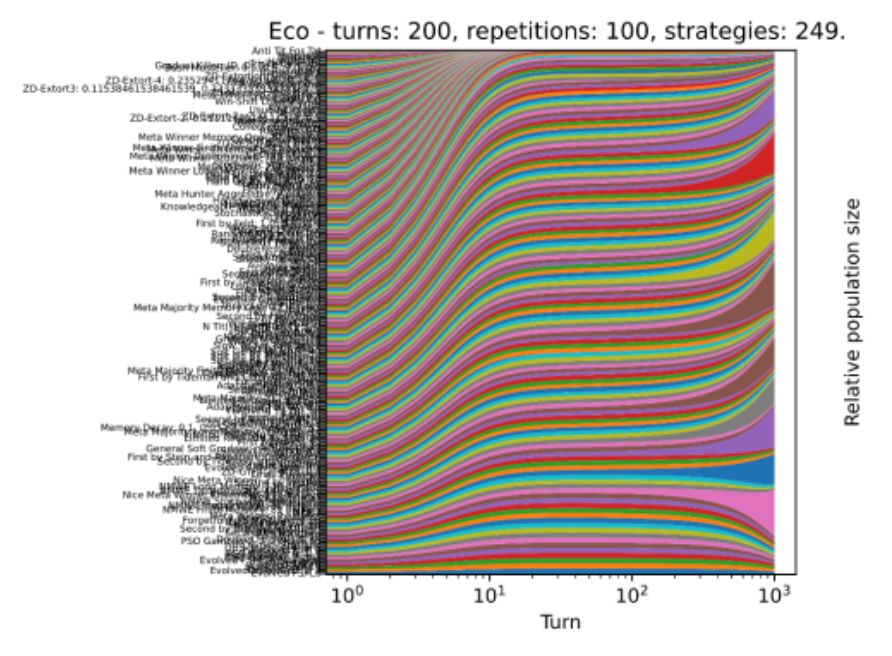
Figure 8: Noisy.

Figure 9: Probabilistic.
WINS
Figures 10-12 show the wins by player type across different kinds of tournament, as measured by scoring more points in an interaction (Glynatsi, 2024).
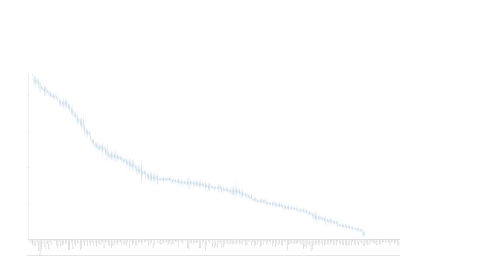
Figure 10: Standard.
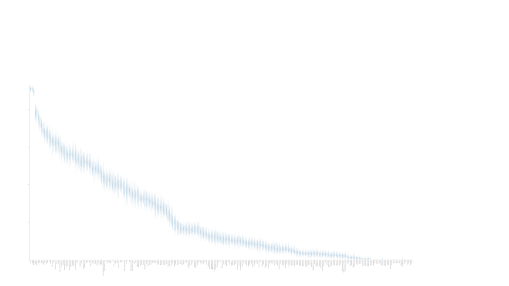
Figure 11: Noisy.
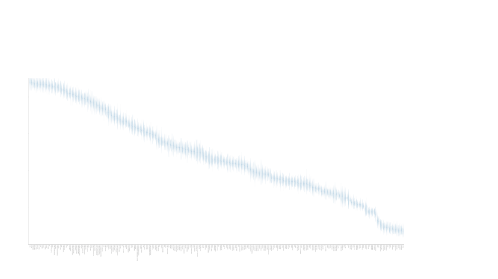
Figure 12: Probabilistic.
Wins are different from mean utility because they depict which strategies “won” interactions. These sometimes differ. For example, a strategy might get very high scores against cooperators (inflating mean utility), but lose to many retaliators, meaning fewer overall wins; similarly, another might score solidly, and thus accumulate many wins.
WHAT IT INDICATES
– In a standard tournament, for each pair of strategies (A vs B): if A’s mean payoff > B’s, it means A gets a “win”; if they are equal, it is usually counted as a “draw”. A strategy with lots of wins consistently beats many others, not just on average but in direct comparison. However, a high mean utility does not always mean the most wins since a strategy can score very high against some but lose against many others.
– In a noisy tournament, noise changes outcomes and “wins” simply show which strategies are more robust to mistakes. For example, Grim Trigger may lose many wins because one accidental defection ruins its match; similarly, WSLS or Generous TFT usually rack up more wins since they recover cooperation better.
– In a probabilistic ending tournament, the game length is uncertain so strategies that rely on “endgame defection” (like cooperating most of the way and defecting at the end) no longer get extra wins. Wins now reward strategies that maintain consistent cooperation throughout, since there is no predictable final round.
Payoff Differences
Each strategy plays against every other strategy (and sometimes, depending on the tournament setting, against itself) and gets an average payoff from those rounds. When comparing two strategies’ mean scores across these encounters, the payoff difference is the gap between those averages.

Figure 13: Standard.
Figure 14: Noisy.

Figure 15: Probabilistic.
WHAT IT INDICATES
- Overall ranking highlights which strategies perform the best and have the greatest advantage over all others.
- If a strategy does well in global competitiveness across the board in all game settings, it is seen as a fairly robust strategy and strong against all others.
- Robustness suggests a flexible strategy which holds up in all situations, so there is no dependency on a certain game setting.
In summary: mean utility is how many points a player scores overall; wins is how often a player outscores their opponent; and payoff differences show by how much a player outscores or gets outscored per opponent.
PAIRWISE PAYOFF DIFFERENCES
The pairwise payoff difference measures the advantage one player has over the other in that head-to-head match: Pairwise Payoff Difference = Payoff (A vs B) – Payoff (B vs A). It is a way to measure relative strength. From here it is possible to see how different types of strategies do in different types of tournaments.
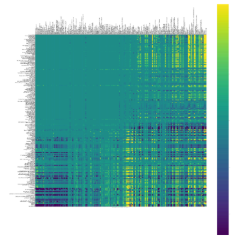
Figure 16: Standard.
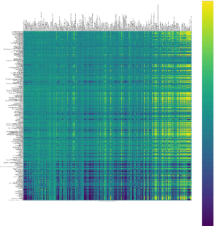
Figure 17: Noisy.
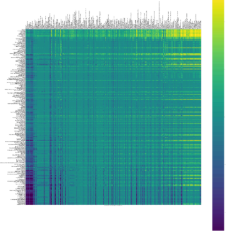
Figure 18: Probabilistic.
– In a standard tournament:
⇒ Defection vs Cooperative – often defector-based strategies win;
⇒ Defection vs Defection – often they both lose;
⇒ Cooperative vs Cooperative – often they both do well.
– In a noisy tournament, often cooperative strategies win against harsher strategies due to the unpredictability of the tournament. They can recover from a mistaken defection and do better in the next round.
– In a probabilistic ending tournament, often cooperative strategies come out on top as well because the last move defection is eliminated.
KEY POINTS
– Symmetry vs asymmetry: If the difference = 0, both strategies did equally well (often mutual cooperation or mutual defection); if the difference > 0, the row strategy consistently outscored the column strategy; and if the difference < 0, the row strategy lost.
– Exploitability: Large differences reveal who exploits whom; for example, in Always Defect vs Always Cooperate, the payoff difference strongly favours AD.
– Fair cooperation: Cooperative pairs (like TFT vs TFT or WSLS vs WSLS) will have a payoff difference of ≈ 0 because both benefit equally. This shows which strategies create stable and equal partnerships.
– Ranking stability: In tournaments, mean utilities are averages, but payoff differences highlights if a strategy’s score comes from beating others head-to-head or just doing “okay” everywhere. For example, a strategy may have a high mean utility but mostly draws (small differences); another may have a similar mean utility but many large positive differences, meaning it actually dominates more opponents.
– In evolutionary terms: If payoff differences favour A over B, then in a population where A and B compete, A tends to spread at B’s expense. Thus, payoff difference matrices are a step toward modelling evolutionary dynamics.
Summary of the Axelrod Tournament
It is important to be able to read these simulations in order to weigh different strategies in different game situations. This is the basis of the Iterated Prisoner’s Dilemma: all of these different graphs show different aspects of the game, including:
- Relative performance: For example, a high score in isolation may not mean that much if another strategy consistently outperforms it head-to-head. In this case, we need to look at pairwise payoff differences.
- Structure in different strategy interactions: It is important to remember that all types of cooperation are not the same, and all types of defection are not the same. One type of defection based strategy might work better than another one. These graphs show which types of strategies work best against most other strategies and highlight clusters of strategies as well.
- Characteristics of each strategy and its advantages: The standard tournament eliminates risk and shows the pure logic of the game without randomness. It is important because it sets the basics and the raw incentive of the Prisoner’s Dilemma. The noisy tournament shows how small errors can change the picture; for example, how the TFT strategy completely collapses because it is too strict and there is no room for error. In the same way, more lenient strategies come out stronger, showing they are more robust. A probabilistic ending tournament eliminates backward-induction strategies, which is important in relation to the real world as there is no known ending.
From here, successful strategies are made from:
- Niceness: Never be the first to defect.
- Provocability: Get mad quickly at defectors and retaliate.
- Forgiveness: Do not hold a grudge once you have vented your anger.
- Clarity: Act in ways that are straightforward for others to understand.
Testing a New Strategy
TIT-FOR-TAT AND ITS LIMITATIONS
Axelrod (1984) popularised TFT by showing that it won repeated game tournaments due to its clarity, reciprocity and ability to sustain cooperation. Subsequent studies, however, identified weaknesses. TFT’s retaliatory nature means that accidental defections can trigger punishment cycles of mutual defection. To address these issues, researchers proposed Generous TFT, which occasionally forgives defections and other variants. However, TFT’s structure left it prone to drift towards unconditional cooperation.
THE WIN-STAY-LOSE-SHIFT RULE
Nowak and Sigmund introduced WSLS, also called “Pavlov”, a simple memory-one strategy: repeat your last move if it produces a win (Reward R or Temptation T), otherwise switch if it produces a loss (Punishment P or Suckers S). This structure makes WSLS self-correcting and adapting: when accidental defections occur, cooperation is usually restored within two or so rounds. The study’s methodology combined Markov chain analysis of memory-one strategy with mutations-selection dynamics in heterogeneous populations. The results showed that WSLS often dominates, especially when error rates are non-negligible.
WSLS reframed cooperation not as reciprocity but as aspiration-based learning. This links game theory to reinforcement psychology, bridging behavioural perspectives and evolutionary perspectives. Later work formalised these insights: as researchers analysed WSLS in finite populations, WSLS became the evolutionary attractor under mutation-selection balance. Conversely, when cooperation is too costly, Always Defect (ALLD) still dominates. This confirmed that WSLS is not universally dominant but excels under conditions where cooperation has moderate benefits.
GLYNATSI ET AL.
In their recent study, Glynatsi, Knight and Harper (Glynatsi et al., 2024) challenge contemporary understanding of winning strategies in repeated games. For decades, Axelrod’s work stood as the cornerstone of IPD theory, championing TFT as the all-purpose winning strategy except in the cases identified by Nowak and Sigmund. However, as our world becomes more complex, the need to reassess these traditional views has become increasingly apparent. This new research arrives at a critical moment, offering fresh insights into how strategies actually succeed in dynamic environments. Glynatsi et al. identify critical limitations in previous approaches: the reliance on small strategy sets, the absence of noise in interactions and fixed game lengths that do not reflect real-world complexity. Traditional research operated under the assumption that simpler strategies, particularly TFT were inherently superior. This study challenged these foundational assumptions by analysing an unprecedented 195 different strategies across thousands of computer tournaments, creating a more comprehensive and nuanced understanding of strategy effectiveness.
By implementing 195 distinct strategies under varying conditions, the researchers created a testing environment of unprecedented complexity. The introduction of noise and uncertainty to mirror real-world scenarios, alongside comprehensive performance metrics that go beyond simple win-loss ratios, establishes a new standard for empirical research in game theory. This approach notably includes variations in tournament sizes, types and conditions, providing a more realistic and nuanced testing environment than previous studies.
The research revealed that successful strategies consistently demonstrate five key properties: initial cooperation (being “nice”), balanced responsiveness to both cooperation and defection, strategic generosity while maintaining competitive edge, sophisticated pattern recognition and environmental adaptability. Performance patterns strongly correlate with matching cooperation rates to population averages, maintaining strategic flexibility and balancing short-term gains with long-term stability. These findings significantly challenge the traditional emphasis on fixed strategies (Picardo, 2024).
Glynatsi et al.’s study makes several significant theoretical contributions, including challenging the notion of universally optimal strategies, introducing a more nuanced understanding of cooperation dynamics and demonstrating the importance of environmental context in strategy success. It provides robust empirical support for the value of adaptive strategies and establishes new frameworks for evaluating strategy effectiveness in complex systems. This research occupies a pivotal position in game theory literature through its comprehensive challenge to Axelrod’s foundational work. Its significance spans theoretical framework development, methodological innovation and cross-disciplinary impact (Axelrod & Hamilton, 1981). The study bridges classical game theory with modern computational approaches, establishes new methodological standards and influences related fields including evolutionary biology, computer science and behavioural economics (Picardo, 2025).
While primarily theoretical, the research offers important practical implications for understanding how strategies must evolve with their environment. It demonstrates the value of balanced approaches over purely aggressive or cooperative strategies and highlights the importance of pattern recognition in strategic decision-making. These insights suggest new approaches for designing adaptive strategic systems in various contexts.
DECEPTIVE TIT-FOR-TAT
This paper examines a variant of sneaky Tit-for-Tat (“Deceptive Tit-for-Tat”) which operates as TFT but includes a strategic deviation. After at least five rounds of mutual cooperation, the system decides to randomly defect twice. The opponent’s response to the sneak then determines the long-term outcome of the simulation. If the opponent continues to operate through the second random defection, the simulation categorises them as a blind defector and is prompted to enter permanent defection. If the opponent retaliates by defecting, the strategy signals forgiveness through two unconditional rounds of cooperation before reverting to standard Tit-for-Tat, after which no more defects are attempted.
This variation of sneaky TFT was emulated to explore the balance between opportunism and cooperation. Traditional Tit-for-Tat maintains mutual cooperation effectively but is predictable and vulnerable to evolutionary drift by unconditional cooperators, who are in turn vulnerable to defect-heavy strategies. Introducing a deviation allows us to test whether short-term defections can improve payoffs without permanently destabilising the cooperation. The two random sneaks create a controlled deviation in the interaction, revealing the opponents tolerance for exploitation and providing insight to the dynamics of trust, retaliation and forgiveness within the system. By observing the opponent’s response, we can distinguish between blind, naive cooperation and resilient ones.
The deliberate two-step defection acts as a trial: if the opponent continues to cooperate they are classed as overly trusting or exploitable, prompting the strategy to take advantage and defect indefinitely to maximise payoff. On the other hand, if the opponent retaliates, this demonstrates the opponent is resilient and the strategy signals forgiveness by cooperating twice before reverting to standard TFT. In this way, the strategy can identify suckers. By identifying suckers the simulation can hopefully distinguish them from resilient opponents who retaliate. Recognising these vulnerable opponents is important as it should enable selective exploitation and maximise payoffs. At the same time, the forgiveness mechanism means resilient opponents should ideally remain engaged in cooperative interactions and promote long-term stability within the simulation. However, while this mechanism can have short-term competitive gains, misidentifying a cooperative but foreign opponent as a sucker may lock the strategy into permanent defection, undermining long-term payoffs and reducing the opportunity for sustained mutual cooperation.
By running this variation, we can capture the play between opportunistic behaviour, strategic resilience and forgiveness, which gives us an understanding of how small deviations influence outcomes in repeated interactions. The inclusion of noise – in this case the random defections – adds a layer of realism and unpredictability to the simulation. Noise can disrupt cooperation and mask the opponents true intentions, which makes it difficult for the standard Tit-for-Tat to maintain long-term stability. Testing the variant of TFT with the presence of noise allows us to assess whether its probing mechanisms are robust to the uncertainty of the simulation and whether the random, opportunistic deviations can still provide an advantage over the opponent without collapsing the cooperative relationships.
The section below shows the results of standard evolutionary tournaments that run Deceptive Tit-for-Tat against various different combinations of other strategies.
Results
In an evolutionary simulation, populations of cooperative and defectors were eliminated, leaving only the standard Tit-for-Tat (nTFT) and the Deceptive Tit-for-Tat (vTFT). While vTFT initially persisted due to its deviations, its intermittent defections meant that its payoff was gradually reduced. In contrast, nTFT maintained cooperation and stability within the simulation, allowing it to outperform vTFT overtime.
This simulation (Figure 19) suggests that even small opportunities deviations can undermine long-term success in the evolutionary setting. While vTFT is designed to exploit the naive opponents, its defections gradually reduce trust and cooperation within the system, ultimately decreasing its ultimate payoff relative to nTFT. This highlights a key trade-off in its repeated interactions, as the short-term gains may be outweighed by the long-term benefits of consistent cooperation as shown in nTFT. In turn, the dominance of nTFT implies that strategies prioritising stability and predictability are evolutionarily more robust. Furthermore, the rapid extinction of the defector and cooperators demonstrates that unconditional cooperation is subject to exploitation due to its vulnerable nature.
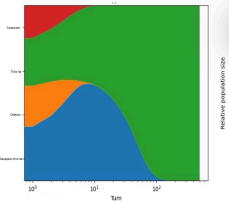
Figure 19: Evolutionary Simulation of nTFT and vTFT.
In this evolutionary model (Figure 20), Tit-for-TwoTats (TF2T), is also present alongside nTFT and vTFT, as well as the cooperators and defectors. After all cooperators and defectors were eliminated, TF2T, which tolerates a single defection before retaliating, initially maintains a stable cooperation with both nTFT and vTFT. However, when reacting with vTFT, its delayed retaliation allowed vTFT to exploit it temporarily, resulting in slightly lower payoffs for TF2T compared to nTFT. Over time, nTFT consistently outperformed TF2T due to its immediate reciprocity and maintenance of cooperative relationships.
The results suggest that strategies which are too forgiving, like TF2T, can be vulnerable to the random opportunistic defections, as they allow exploitative strategies to gain a temporary advantage. While TF2T’s tolerance provides resilience against occasional errors or noise, this same feature reduces its evolutionary competitiveness relative to its strict reciprocators like nTFT in populations where these random defections exist. These finds back up the importance of balancing forgiveness and retaliation. As too much forgiveness can invite exploitation, while immediate reciprocity, as in nTFT, appears more evolutionarily robust in mixed populations with both cooperative and opportunistic strategies.
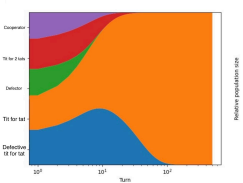
Figure 20: Evolutionary Simulation of nTFT, vTFT and TF2T.
Omega Tit-for-Tat (oTFT) is a strategy designed to avoid being trapped in repetitive loops. We tested this variant alongside nTFT, TF2T’s and vTFT. By the end of the simulation, all nTFT strategies had stagnated, maintaining consistent mutual cooperation. TF2T, despite a slower start, survived and maintained full cooperation, demonstrating its resilience in the population. In contrast, nTFT, which is unable to sustain continuous cooperation, failed to compete effectively and was eliminated, while oTFT coexisted with other cooperative strategies but did not outperform them.
This simulation highlights the importance of sustained cooperation, particularly in evolutionary stability. Strategies capable of maintaining full cooperation, like nTFT and TF2T, dominate over opportunistic or deceptive strategies that cannot consistently cooperate. oTFT’s design to avoid loops allows flexibility but does not necessarily give a competitive advantage when cooperation is already well established. This suggests that adaptability is only advantageous when it improves payoffs relative to stable cooperative interactions.
On the other hand, strategies that cannot achieve continuous cooperation, such as vTFT, are evolutionarily unviable, underscoring the critical role of reliability and reciprocity in long-term success within repeated interaction populations.
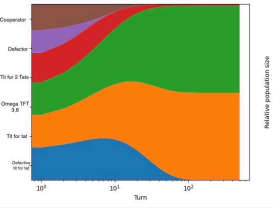
Figure 21: Evolutionary Simulation of nTFT, vTFT, TF2T and oTFT.
Real-World Implications
Suppose two coworkers are working on a project together: if one coworker consistently contributes to the project (cooperates) and the other coworker consistently slacks off (defects), the first coworker may become frustrated and stop contributing as much. However, if both coworkers are using the Tit-for-Tat strategy, they will both be more likely to contribute to the project, leading to a better outcome for everyone involved. Another example of TFT operating well in repeated environments is supply contracts: if both parties use the TFT strategy, they will be more likely to cooperate and reach a mutually beneficial agreement. This can lead to a long-term partnership that benefits both the business and the supplier.
The implementation of game theory in business strategy, particularly approaches like Tit-for-Tat, reveal a fundamental paradox in strategic decision-making: the more intricate and calculated the strategy becomes, the more likely it is to fail in practical application. While game theory provides valuable frameworks for understanding business interactions, the tendency to over-complicate these strategies can lead to delayed responses, misinterpretation of signals and damaged business relationships. This disconnect between theoretical elegance and practical effectiveness manifests across various business contexts, from pricing decisions to market entry strategies or implementation of tactics, where overthinking can paralyse decision-making processes and undermine the advantages these strategies aim to create.
Through both theoretical analysis and the examination of the U.S. and China trade war, we will demonstrate that the effectiveness of strategic frameworks significantly diminishes when they become too calculated, ultimately arguing that simpler, more direct approaches often yield better outcomes in maintaining productive relationships and achieving competitive advantages
THE UNITED STATES AND CHINA TRADE WAR
Since March 2018, the U.S. and China have been engaged in Tit-for-Tat trade tariffs. The U.S. imposed tariffs on metals, such as steel and aluminum, citing national security as the reason and accusing China of unfair trade practices like exporting more to the U.S. than it imported. There have been multiple attempts to resolve the issue and make a trade deal, including a 90-day truce which halted new tariffs and initiated negotiations, and a Phase One trade deal, where China agreed to purchase additional U.S. goods. However, the countries spiralled into a trade war where neither of them wished to unilaterally cut tariffs. This situation mirrors the Nash equilibrium which is common in the Prisoner’s Dilemma.
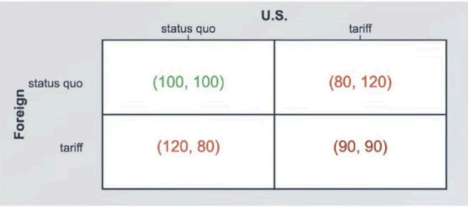
Figure 22: Prisoner’s Dilemma in the U.S.-China Trade War.
Each player, the U.S. and China, has two options: (1) to cooperate (C) and maintain the status quo/the existing state of tariffs; or (2) to defect (D) and impose tariffs. It is a win-win if both countries cooperate as the trade flows remain stable, therefore both countries benefit from trade and both countries receive a relatively large payoff. If one defects and the other cooperates, the defecting country gains colossal leverage by being able to protect domestic industries yet still be exposed to international trade. Additionally, the government can collect tariff revenue, further boosting the economy. The cooperating country is hurt as local companies face tougher competitions from the defecting country’s firms. Local products are bought only by the citizens of the cooperating country, while foreign products are bought by people from both countries. When both countries defect, a trade war erupts which damages both economies. All consumers face higher prices and the economic growth slows down worldwide as trade between two countries is now more expensive.
This scenario is a case of the Prisoner’s Dilemma as T = 120 (temptation to defect) > R = 100 (reward for mutual cooperation) > P = 90 (punishment for mutual defection) > S = 80 (sucker’s payoff). A Nash equilibrium is also created. For both countries, imposing tariffs is always a better choice as it gives a better payoff than maintaining the status quo in each scenario (120 > 100 and 90 > 80). Therefore, the dominant strategy is always imposing tariffs regardless of the opponent’s choice – known as the Nash equilibrium. However, this is not the best possible outcome because if both countries chose to cooperate they would receive a payoff of 100 instead of 90. This example perfectly illustrates the classic Prisoner’s Dilemma scenario: even though choosing to cooperate would be better for both countries, the lack of trust and fear of being leveraged drive both toward defection. This explains why countries retaliate with tariffs, even if imposed by countries with the strongest economies.
The analysis of game theory applications in business strategy, exemplified through the U.S.-China trade war, demonstrates a fundamental paradox: while theoretical frameworks like the Prisoner’s Dilemma accurately predict strategic outcomes, the practical implementation of increasingly complex strategies often undermines their effectiveness. The trade war’s escalation from 2018 onward, despite both nations understanding that mutual cooperation would yield superior payoffs (100 vs 90), illustrates how overthinking strategic responses can trap decision makers in suboptimal Nash equilibria. The temporary truces and failed negotiations highlight that when strategies become too calculated and complex, they create delays, misinterpretations and damaged relationships that prevent the very cooperation these frameworks are designed to facilitate. Ultimately, this research suggests that while game theory provides valuable insights into strategic interactions, simpler, more direct approaches often yield better long-term outcomes in maintaining productive business relationships and achieving sustainable competitive advantages.
Conclusion
Across our simulations, it became evident that the long term success of strategy depends less on short bursts of opportunism and more on predictability, reciprocity and, most importantly, stability. While variations such as vTFT or forgiving approaches such as TF2Ts offered interesting insights, both revealed critical weaknesses within the strategies. vTFT’s opportunistic random deviations eroded payoffs overtime, while TF2T’s tolerance created openings for exploitation. Similarly, when we tested defensive strategies such as oTFT, their reluctance to consistently engage in cooperation reduced their competitiveness, thus leaving them unable to outperform simpler rules.
In contrast, the nTFT consistently maintained cooperation, punished detection and avoided unnecessary opportunities. Its balance of niceness, retaliation and forgiveness ensured that it was both evolutionary robust and resilient to collapse, especially under noisy conditions. The comparative elimination of less stable or overly defensive strategies reinforces the conclusion that nTFT remains an effective framework for sustaining cooperation in repeating interactions.
Beyond the theory we tested here, this outcome reveals important real-world implications: it shows us that strategies that prioritise clarity and reliability are more successful than those that rely on excessive caution or opportunistic defection. While our experimentation with alternative approaches highlights the balance between exploitation and cooperation, our results show that the endurance of nTFT provides a stable foundation for long-term success.
Bibliography
Axelrod, R. (1980) Effective Choice in the Prisoner’s Dilemma, Journal of Conflict Resolution, 24(1), pp. 3-25. <https://www.jstor.org/stable/173932>
Axelrod, R. & Hamilton, W.D. (1981) The Evolution of Cooperation, Science, 211(4489), pp. 1390-1396. <https://www.science.org/doi/10.1126/science.7466396>
Axelrod-Python-Tournament (2015) Axelrod-Python Project Revision [Internet]. <https://axelrod-tournament.readthedocs.io/en/latest/index.html>
Glynatsi, N.E., Knight, V. & Harper, M. (2024) Properties of Winning Iterated Prisoner’s Dilemma Strategies, PLOS Comput Biol, 20(12): e1012644. <https://doi.org/10.1371/journal.pcbi.1012644>
Investopedia (2025) What Is the Prisoner’s Dilemma and How Does it Work? Investopedia [Internet].<https://www.investopedia.com/terms/p/prisoners-dilemma.asp>
Picardo, E. (2024) How Game Theory Strategy Improves Decision-Making, Investopedia [Internet]. <https://www.investopedia.com/articles/investing/111113/advanced-game-theory-strategies-decisionmaking.asp>
Picardo, E. (2025) The Prisoner’s Dilemma in Business and Economy, Investopedia [Internet]. <https://www.investopedia.com/articles/investing/110513/utilizing-prisoners-dilemma-business-and-economy.asp>
Tesfatsion, L. (2023) Notes on Axelrod’s Iterated Prisoner’s Dilemma (IPD) Tournaments, Econ 308 [Internet]. <https://faculty.sites.iastate.edu/tesfatsi/archive/econ308/tesfatsion/axeltmts.pdf>
Yi, M. (n.d.) A Complete Guide to Violin Plots, Atlassian [Internet]. <https://www.atlassian.com/data/charts/violin-plot-complete-guide>


